

Introduction
When gasoline prices climb, drivers everywhere start asking the same question: what’s really behind the pain at the pump? The answers are rarely simple. Shifting global oil markets, OPEC decisions, wars and sanctions disrupting supply, refinery outages, pipeline constraints, seasonal weather and demand swings can all play a role. Yet one pattern stands out clearly in the data. Gasoline is more expensive in Democratic-controlled states, and over the past five years prices have risen faster there.
In early 2026, states with unified Democratic control (the governorship plus both legislative chambers) averaged $3.69 per gallon, while unified Republican states averaged $3.14 per gallon, a gap of $0.55 per gallon. Averaged over our full 2017–2026 data window, the gap is about $0.45 per gallon.
But the headline gap is not the whole story, and a careful look at the data tells a more useful one. Most of the gap is traceable to identifiable policies and supply geography: state gasoline taxes, West Coast fuel regulations, and the region’s hostility to refineries. Those policies were built up over decades, and the recent acceleration in West Coast prices lines up with specific policy and refinery events in 2022 and 2023. This brief summarizes the findings.
Key Findings
- In 2026, gasoline is $0.55 per gallon more expensive in unified-Democratic states than in unified-Republican states ($3.69 vs. $3.14). Over 2017–2026, the gap averaged about $0.45.
- About two-thirds of the gap is explained by four measurable factors: state gasoline taxes, the West Coast refining region, California-specific fuel costs, and federal reformulated-gasoline rules. A statistically significant residual of about $0.13 per gallon remains.
- State gasoline taxes are the single largest policy lever: about 89 cents of every dollar of state gas tax shows up at the pump, and Democratic-controlled states tax fuel more heavily.
- Over the past five years, prices rose by $0.86 per gallon in Democratic states versus $0.62 in Republican states. Most of that difference comes from just four states: California, Hawaii, Washington, and Oregon. Excluding them, the gap shrinks from $0.24 to $0.09.
- The sharp widening of the West Coast price premium is recent, not geographic destiny: after accounting for taxes and other factors, the premium ran $0.20–$0.44 per gallon from 2017 to 2021, then roughly doubled in 2022 and reached $0.91 by 2026—timing that matches new carbon-pricing programs and the loss of West Coast refining capacity.
- The gap reflects decades of accumulated policy, not necessarily who holds office today. A state’s cumulative years of Democratic control since 2001 predict its 2026 prices better than its current party control does.
What the Maps Show
The geography of gasoline prices is stark. In early 2026, the most expensive states are overwhelmingly on the Pacific: California ($5.03), Hawaii ($4.86), Washington ($4.61), Oregon ($4.17), Nevada ($4.12), and Alaska ($4.02). The cheapest states form a contiguous South-Central and Plains belt: Oklahoma ($2.86), Kansas ($2.92), Arkansas ($2.96), Mississippi ($2.97), Iowa ($2.98), and Louisiana ($2.99).
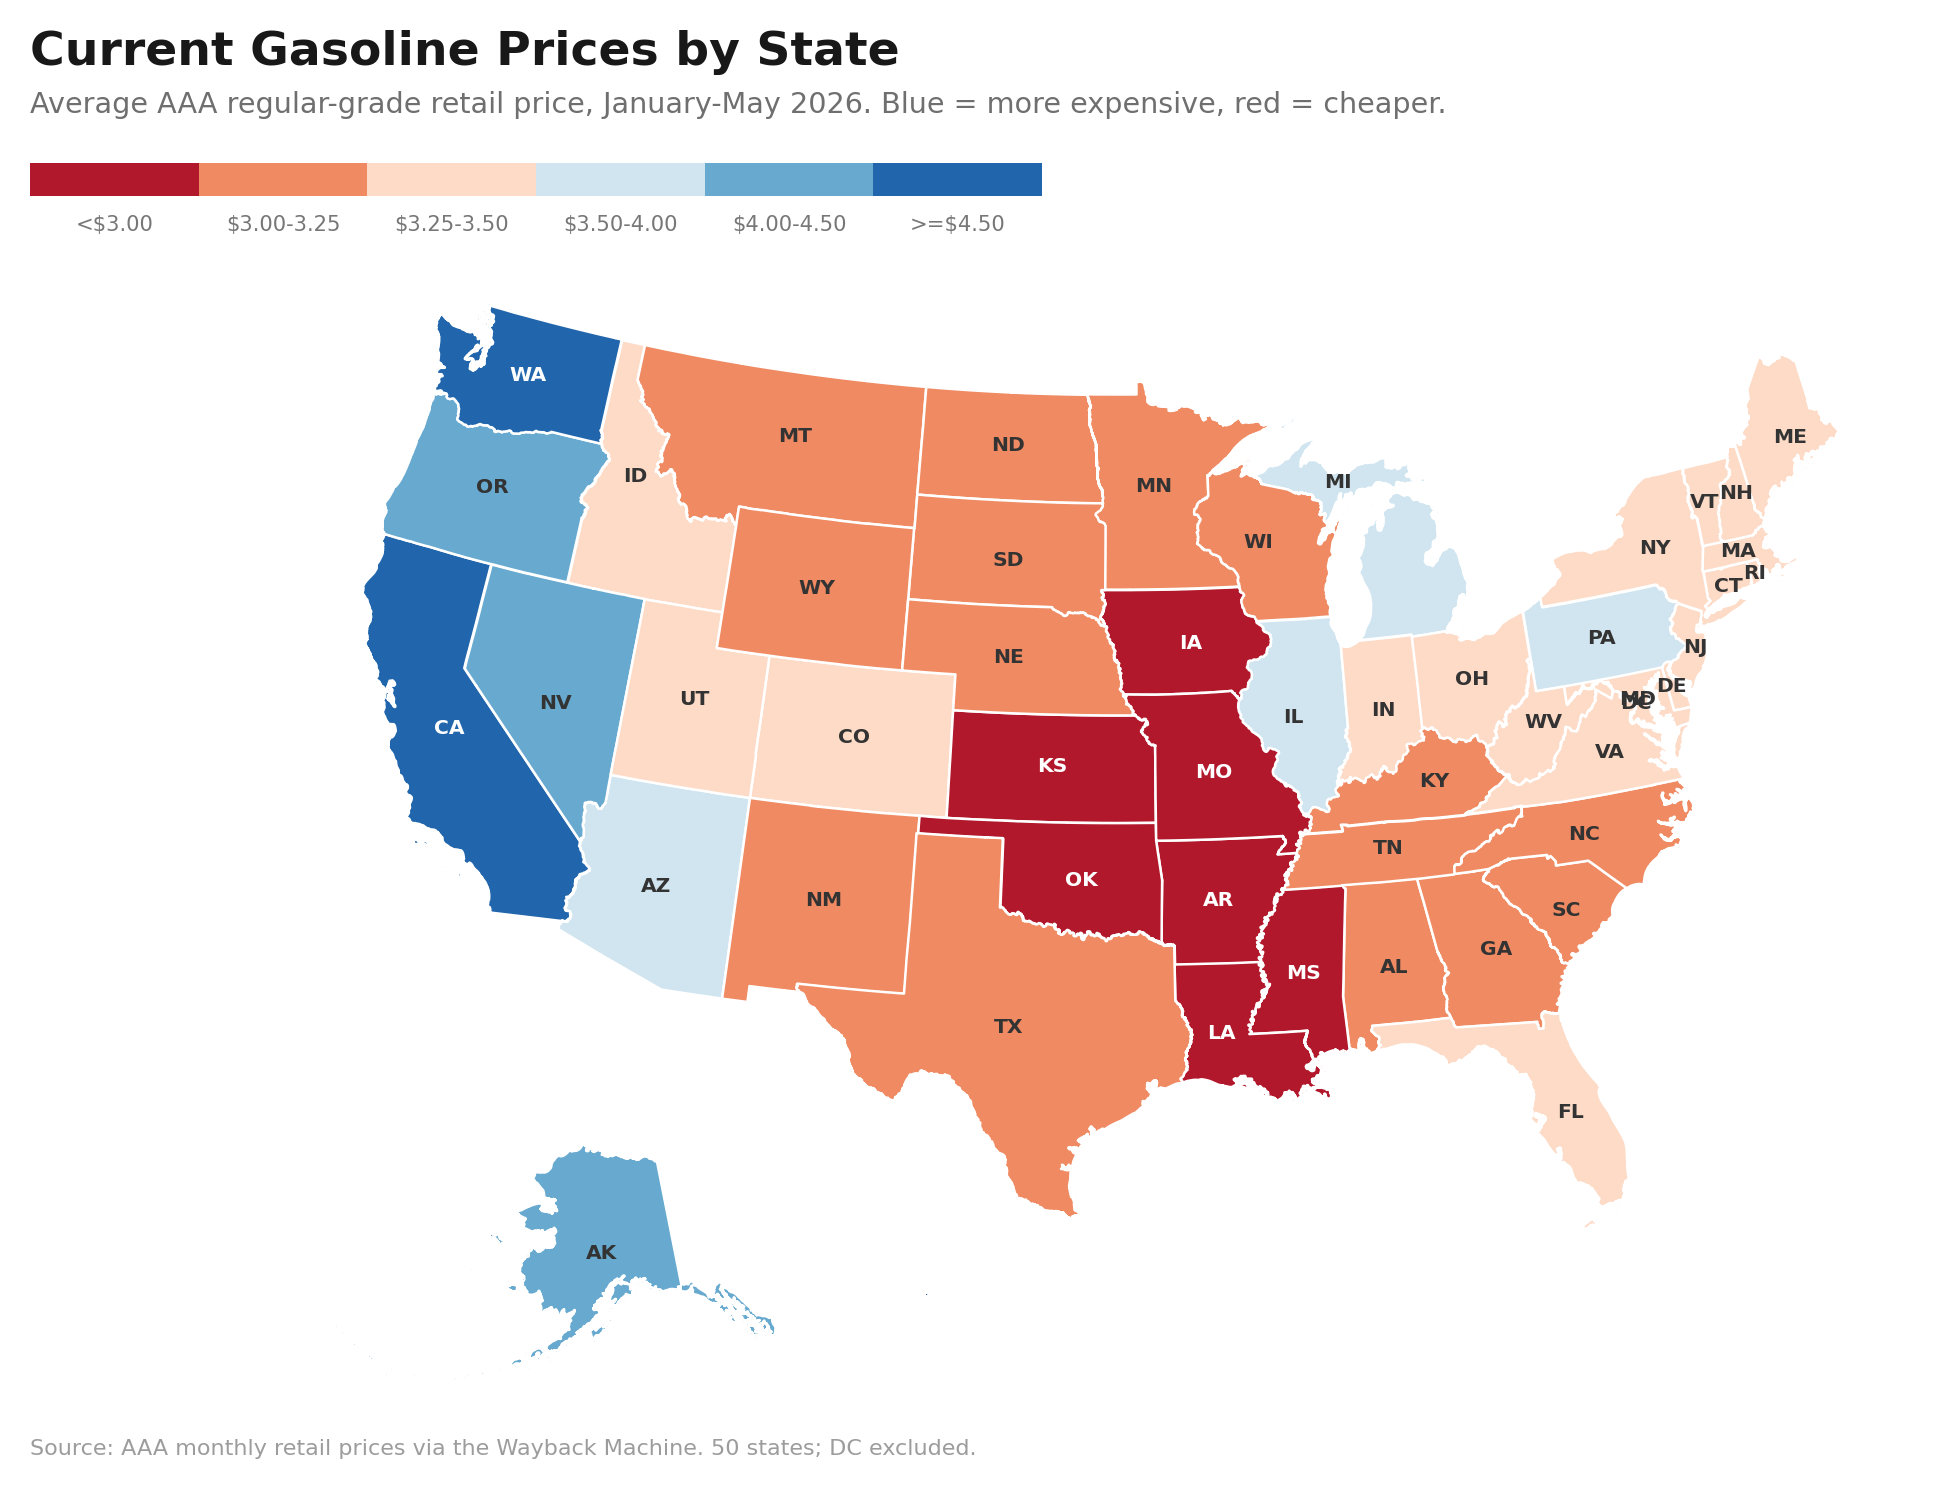
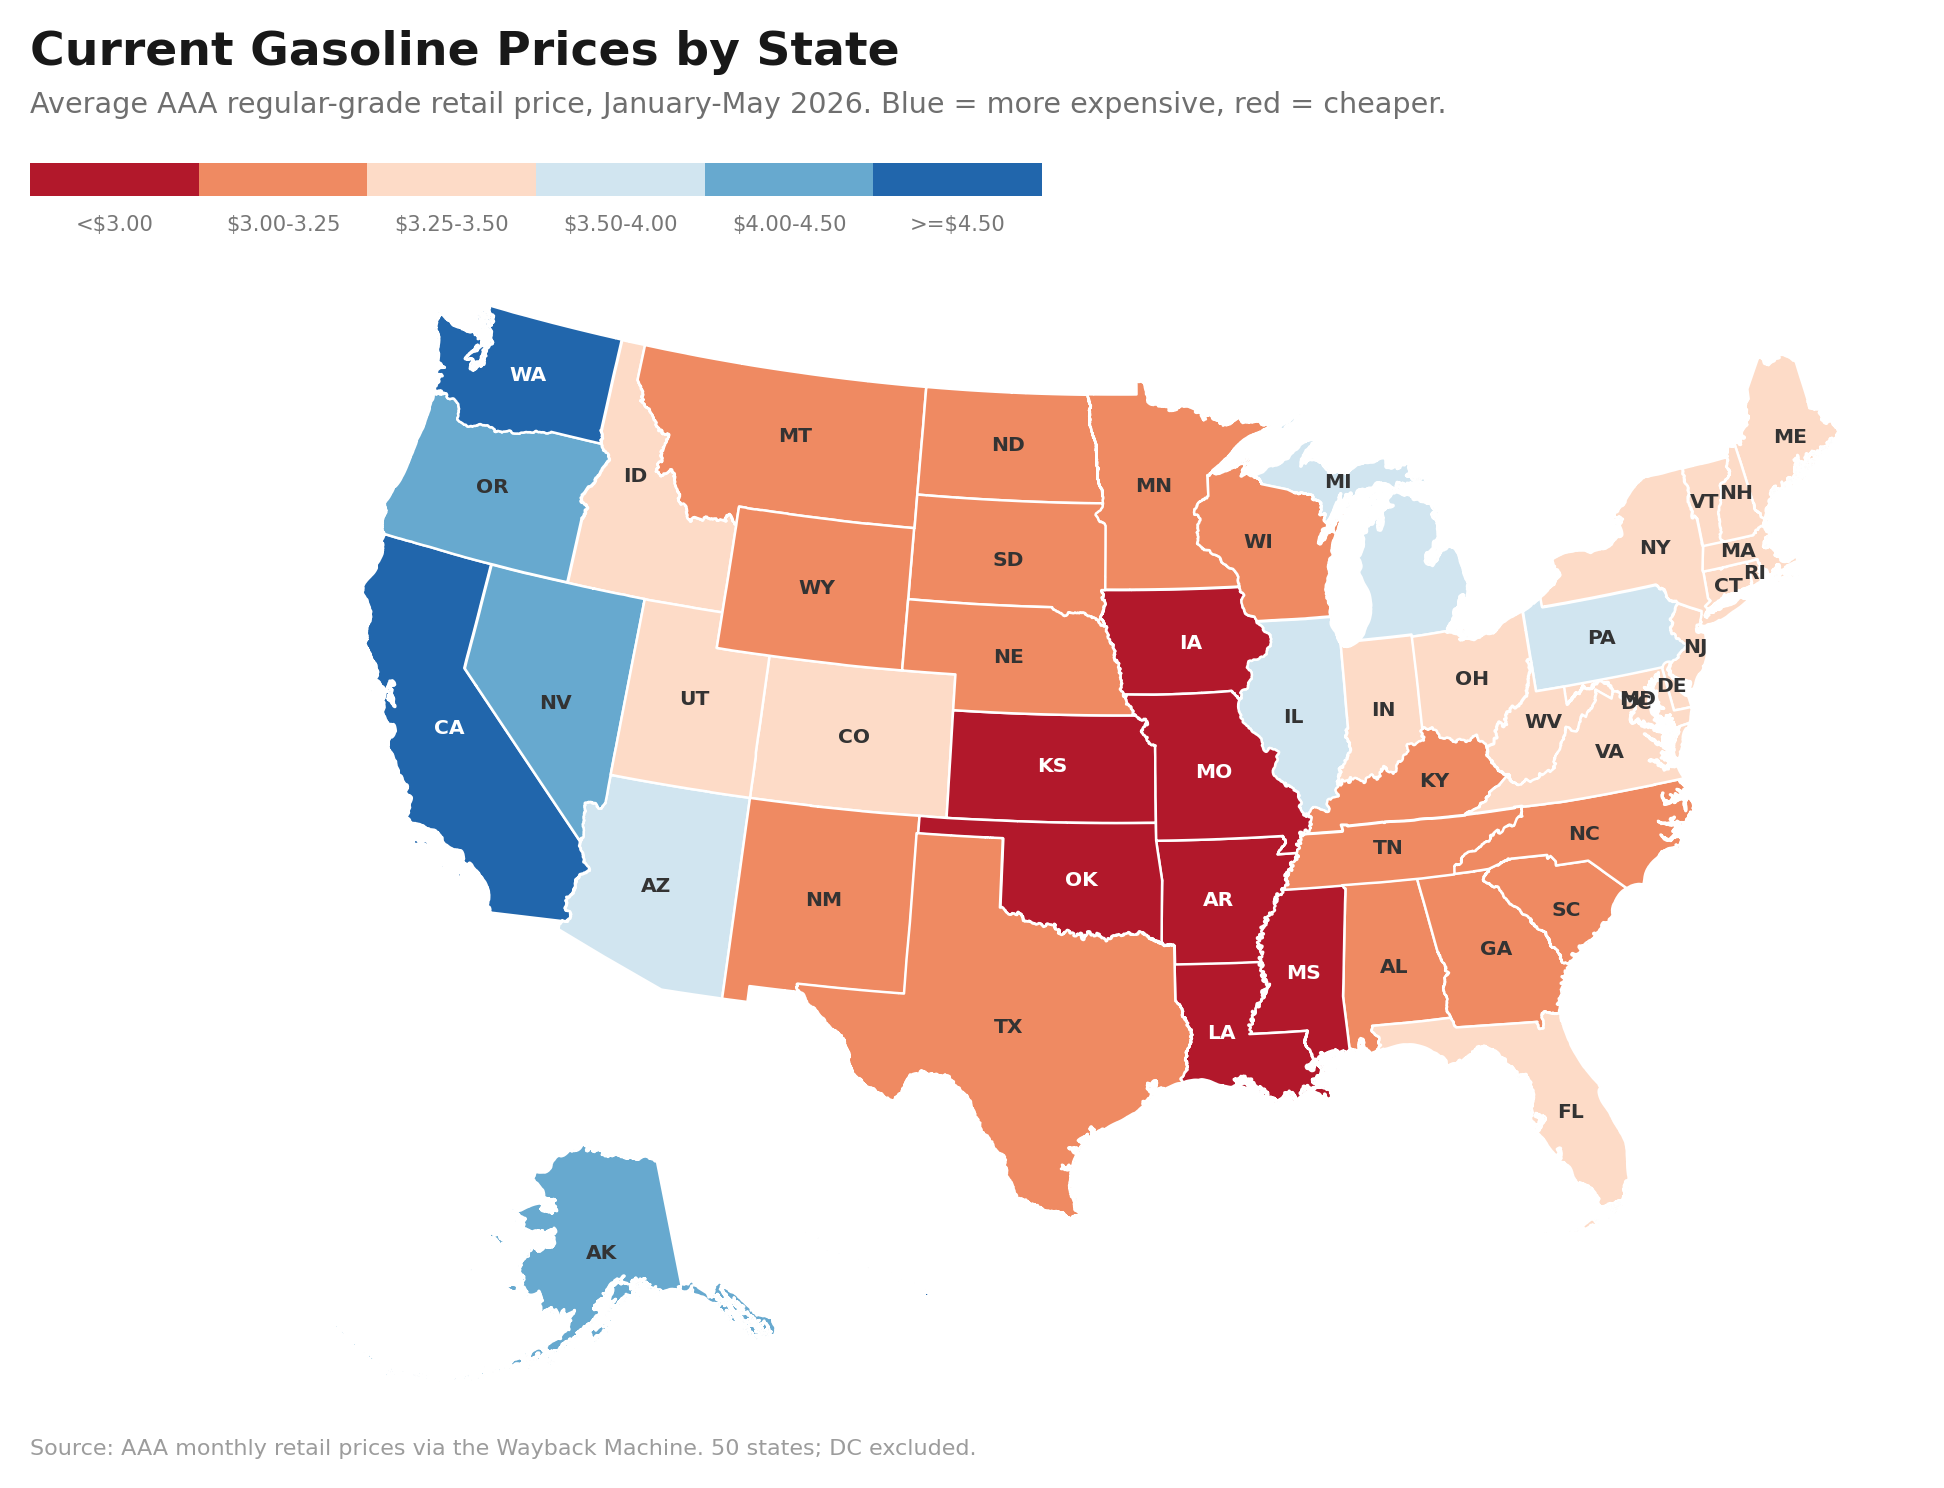
Figure 2. Five-year change in gasoline prices, January–May 2021 to January–May 2026. Blue = larger increase.
Question 1: Why Is Gasoline More Expensive in Blue States?
Some of the price gap could, in principle, have nothing to do with policy: a state might be cheap because it pumps its own crude, or expensive because it sits outside the continental United States. We test those possibilities before measuring anything else, while also removing the national price cycle. Isolation matters a great deal (being in Alaska or Hawaii adds roughly $0.78 per gallon at this stage), but producing crude oil turns out to make no difference at all, a null result we return to below. With the national cycle and these endowments accounted for, the premium associated with unified Democratic control is $0.41 per gallon.
From there, we add gasoline-relevant policy factors to the model one at a time and watch how much of the $0.41 each can account for. Because these factors overlap (high-tax states also tend to be West Coast states), the individual reductions cannot simply be added together. Together, the full set explains about two-thirds of the premium:
| Model | Blue-state premium | Reduction from $0.41 |
| Baseline (national cycle + fixed geography) | +$0.41 | — |
| Add state gasoline taxes alone | +$0.27 | 34% |
| Add the California indicator alone | +$0.32 | 22% |
| Add refining region (PADD) alone | +$0.21 | 49% |
| Add all four factors together | +$0.13 | 68% |
Table 1. How the estimated Blue-state premium shrinks as policy factors are added. Middle rows add one factor at a time; factors overlap, so their individual reductions do not sum to the combined 68%.
Measured one factor at a time, each additional dollar of state gasoline tax raises pump prices by about $0.89. This is a textbook result that most of the fuel tax is passed through to drivers. Being in the West Coast refining district (PADD 5: California, Oregon, Washington, Nevada, Arizona, Alaska, and Hawaii) adds about $0.59 per gallon over the East Coast baseline; being Alaska or Hawaii, cut off from mainland supply, adds about $0.46; and California-specific factors (its unique CARB fuel blend plus, unique hostility against oil production and refining, and other California specific policies) add about $0.44. Notably, producing crude oil or hosting refineries does not, by itself, make a state’s gasoline cheaper once taxes and the refining region are accounted for.
After all of that, a residual premium of about $0.13 per gallon remains in Democratic-controlled states. It is small but statistically robust, and it likely reflects gasoline-relevant policies that the model cannot measure directly. The full model fits the data closely: it explains 95 percent of the variation in monthly state gasoline prices, up from 82 percent before the four factors in Table 1 are added.
Question 2: Why Did Blue-State Prices Rise Faster?
In the same January–May window in 2021 and 2026, gasoline prices rose in every state. But the increase was larger in Democratic states:
| Control (2026) | States | Avg. 2021 | Avg. 2026 | Increase |
| Democratic | 16 | $2.83 | $3.69 | +$0.86 (+30.4%) |
| Split control | 11 | $2.68 | $3.44 | +$0.76 (+28.4%) |
| Republican | 22 | $2.52 | $3.14 | +$0.62 (+24.5%) |
| All 50 states | 50 | $2.66 | $3.38 | +$0.72 (+27.1%) |
Table 2. Five-year change in AAA regular-grade prices, equal January–May windows. DC excluded; Nebraska’s nonpartisan legislature places it outside the party rows. Figures are rounded.
The Democratic–Republican gap in the five-year increase is about $0.24 per gallon (p = 0.005). But it is heavily concentrated:
| Five Largest Increases | Five Smallest Increases | ||
| State | Increase (2021–2026) | State | Increase (2021–2026) |
| Washington | +$1.49 | Iowa | +$0.38 |
| California | +$1.33 | Oklahoma | +$0.43 |
| Hawaii | +$1.32 | South Dakota | +$0.44 |
| Oregon | +$1.19 | Kansas | +$0.45 |
| Alaska | +$1.12 | North Dakota | +$0.45 |
Table 3. Five-year dollar change in AAA regular-grade price, January–May 2021 to January–May 2026.
Exclude California, Hawaii, Washington, and Oregon, and the Blue-state increase falls to $0.71 versus $0.62 for Red states, a gap of $0.09 that is still detectable in dollar terms but no longer statistically significant when measured as a percentage. Split-control states fall cleanly in between: in the party-only regression, their five-year increase runs about $0.15 per gallon above Republican states (p = 0.04), a step-ladder ordering consistent with policy intensity rising with the degree of Democratic control.
States that started expensive in 2021 also saw the biggest dollar increases (the correlation between the 2021 price level and the five-year dollar change is 0.79). That relationship is not primarily mechanical: most of gasoline’s cost structure (crude oil and fixed excise taxes) moves in cents per gallon, not in percentages, and when prices fell in 2023, the expensive states did not fall more, as a proportional pattern would imply. A modest part of the relationship is genuinely price-scaling, because percentage-based fuel taxes and fees in about a dozen states grow with the price. Mostly, though, the starting price is a stand-in for West Coast geography and policy: the states that were already expensive are the same states whose carbon programs and supply constraints kept adding costs. Once West Coast geography is included, the starting-price coefficient falls sharply, from about +$0.68 to about +$0.23 per dollar of initial price, while the party label itself adds only about $0.08 per gallon and is only marginally significant. The faster Blue-state increase is mostly a West Coast story, not necessarily a uniform Blue-versus-Red phenomenon.
Question 3: What Changed on the West Coast?
The West Coast premium is the largest single geographic factor in the analysis, and it is often treated as a permanent feature of the region, with people arguing that the region has isolated refining, special blends, and isn’t pipeline-connected to the Gulf Coast. The data suggest something else. After our model strips out taxes, the California indicator, federal fuel rules, and Alaska/Hawaii isolation, the remaining West Coast premium was modest from 2017 through 2021, ranging from $0.20 to $0.44 per gallon. It roughly doubled to $0.67 in 2022 and climbed to $0.91 by 2026.
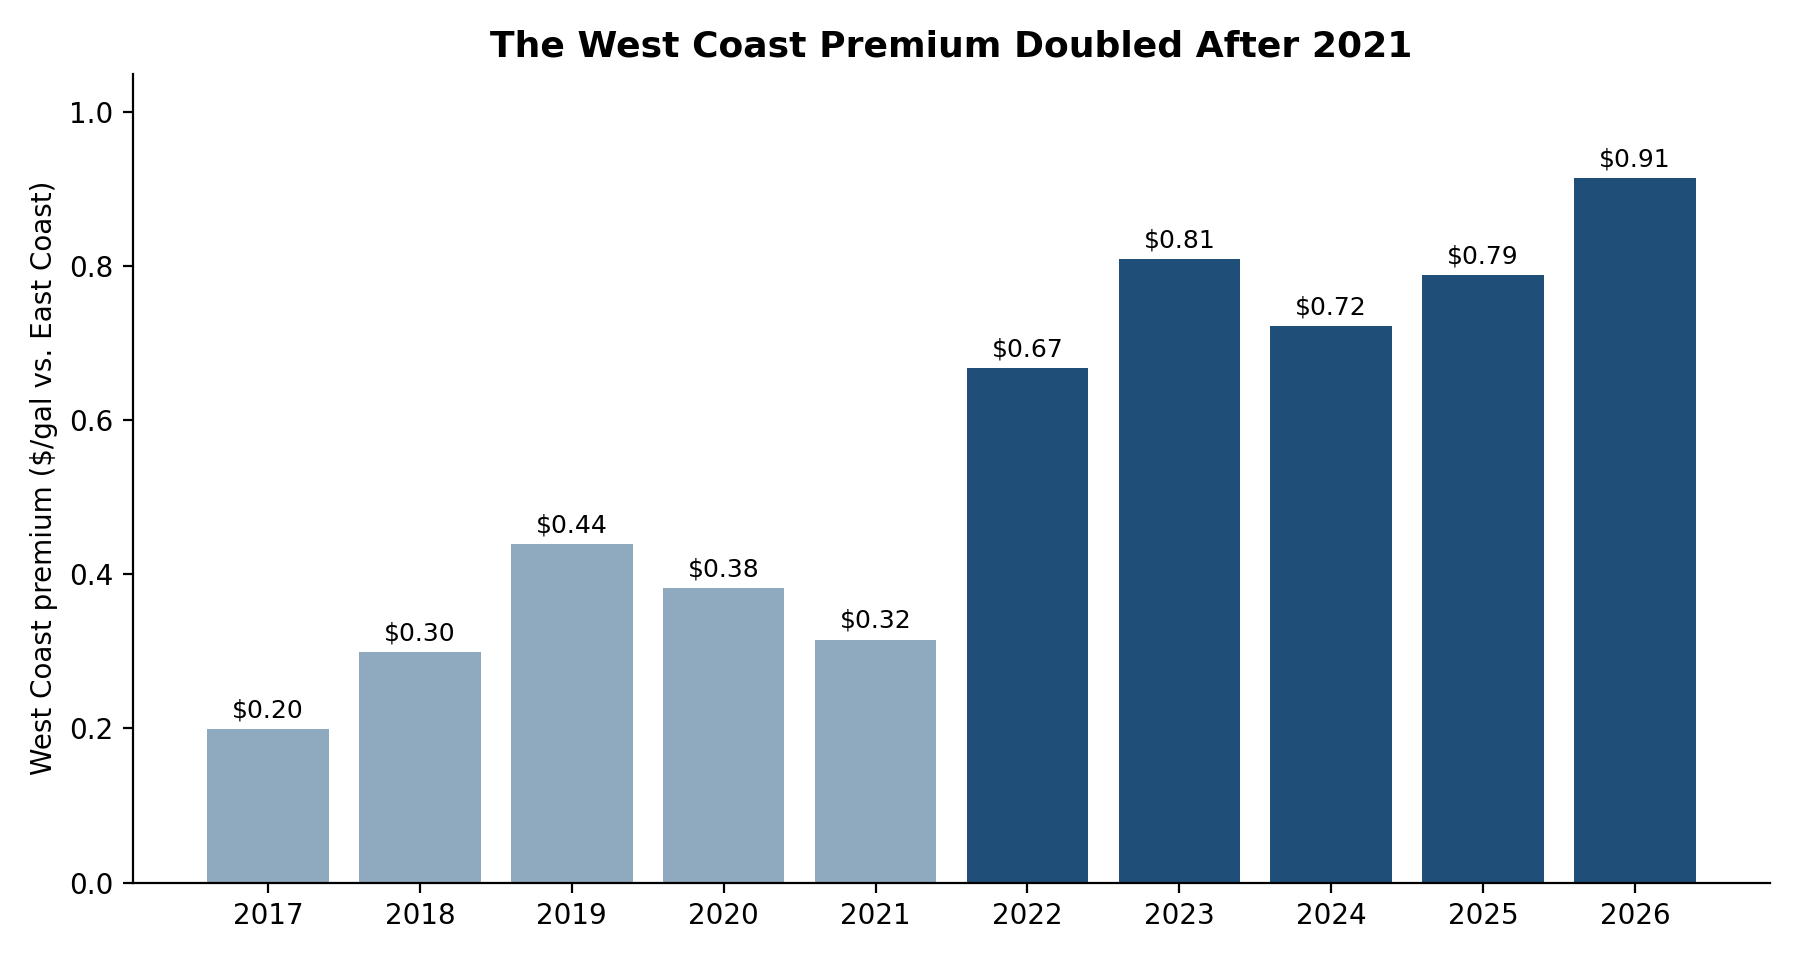
Figure 3. The West Coast (PADD 5) price premium over the East Coast by year, after accounting for taxes, the California indicator, federal fuel rules, and Alaska/Hawaii isolation.
First, Washington’s Climate Commitment Act (a cap-and-trade program covering motor fuels) and Clean Fuel Standard both took effect on January 1, 2023. That single, known start date gives us a cleaner before-and-after test than anything else in our data: quasi-experimental in style, though still observational. Our model includes a variable that marks when a state has a carbon program covering motor fuels; when we drop California and Oregon, the only other states that have one, the only switch left in the data is Washington’s, in January 2023. The estimated effect is then identified solely by how Washington’s prices moved on that date relative to those of the 46 states that never adopted such a program. Estimated that way, the effect is $0.41 per gallon; re-estimated, comparing Washington strictly against its own pre-2023 baseline, it is $0.48 per gallon. A simple non-model check points in the same direction: Washington’s gasoline price rose about $1.00 across the pre/post-2023 break, compared with about $0.50 nationally. That roughly $0.50 extra increase is close to the two model-based Washington estimates. Three methods, from regression to arithmetic, land within eight cents of one another. The estimate technically captures everything that changed in Washington at the start of 2023, but the two carbon programs are by far the most plausible drivers.
Second, California’s carbon costs climbed: cap-and-trade allowance prices roughly doubled between 2021 and 2023, raising the embedded carbon cost in every gallon sold there. Oregon’s Clean Fuels Program, in place since 2016, works similarly.
Third, the region lost refining capacity. Phillips 66’s Rodeo refinery (about 120,000 barrels per day) ceased crude refining in early 2024 to convert to renewable diesel, after Marathon’s Martinez refinery made the same conversion in 2022–2023. Apart from an Arizona pipeline link to the Gulf Coast, the West Coast has no major pipeline connection to the rest of the country, so lost capacity cannot easily be replaced.
These costs also do not stop at state borders. When the three carbon program states (California, Washington, and Oregon) are removed from the model entirely, the remaining West Coast premium is still about $0.52 per gallon, driven mostly by Nevada and Arizona. Neither state has a carbon program of its own, but both are largely supplied by California refineries and pipelines, so West Coast policies and supply costs propagate to neighboring states that never enacted them. The West Coast premium is real, but its sharp widening is recent and tied to identifiable policy and supply events rather than to long-standing geography.
Question 4: Is This About Who Is in Office Today?
Not necessarily. This is the most important nuance in the data. Gasoline prices reflect tax codes and fuel regulations built up over time, not the current legislative session. Democratic control fifteen years ago still significantly predicts a state’s 2026 gasoline price: states that were under unified Democratic control in 2011 average about $0.48 per gallon more in 2026 (p = 0.03), and unified control in 2016 or 2021 predicts comparable differences (+$0.65 and +$0.54, respectively). A state’s cumulative years of unified Democratic control since 2001 explain about 25 percent of today’s price differences, while current control alone explains about 20 percent. When both are put in the same model, the cumulative history carries all the predictive power essentially, while current control collapses to nothing (+$0.10, p = 0.50). In concrete terms, each additional year of unified Democratic control since 2001 is associated with about 3.6 cents per gallon in today’s prices (p = 0.003), so a state with sixteen such years carries roughly $0.57 per gallon. The tax code shows the same accumulation: states under unified Democratic control in 2021 levy total gasoline taxes about 11 cents per gallon higher than other states (p = 0.006).
Conclusion
Democratic-controlled states have higher gasoline prices, and over the past five years, prices have risen faster there. Both gaps are real. But neither is well described as only an effect of today’s party label. About two-thirds of the price-level gap traces to identifiable policy and geography: state gasoline taxes, the West Coast refining region, California-specific fuel costs, and federal fuel rules. What remains is a small but statistically significant residual of about $0.13 per gallon. The faster five-year increase is mostly concentrated in states that already had high prices because of West Coast policy and supply geography—four Pacific states whose carbon-pricing programs and refinery losses arrived together in 2022 and 2023.
The political signal in gasoline prices is real, but it is a signal of accumulated policy choices: fuel taxes, carbon taxes, and regulatory environments built over decades, rather than of who happens to hold office right now. For policymakers, that is the actionable point: the levers that explain the gap are specific and identifiable, and the largest of them, state fuel taxes and transportation carbon taxes, pass through to consumers nearly dollar for dollar.
A Note on Data and Methods
Prices are AAA regular-grade retail gasoline prices by state, collected monthly from archived web snapshots, January 2017 through June 2026 (the June 2026 value is a single-day snapshot from June 8, 2026; 2026 “current” figures are January–May averages). Political control is Ballotpedia state-trifecta data, 2001–2026; “unified” control means one party holds the governorship and both legislative chambers. Gasoline taxes are the Tax Foundation’s total state taxes and fees on gasoline. Party comparisons cover 49 states: the District of Columbia has no state government, and Nebraska’s legislature is nonpartisan. All regression estimates, robustness checks, and limitations are documented in the accompanying report, Gasoline Prices and State Political Control: Technical Companion.

