
The White House recently released an update of its Working Group’s estimates of the so-called “social cost of carbon” (SCC). The relevant figures, which will guide federal regulatory decisions, have in some cases more than doubled in just three years. In this post I’ll show just how dubious these moves are, and that there is little “science” behind the whopping numbers.
What Is the “Social Cost of Carbon” and Why Does it Matter?
The Environmental Protection Agency (EPA) provides this definition for the SCC:
EPA and other federal agencies use the social cost of carbon (SCC) to estimate the climate benefits of rulemakings. The SCC is an estimate of the economic damages associated with a small increase in carbon dioxide (CO2) emissions, conventionally one metric ton, in a given year. This dollar figure also represents the value of damages avoided for a small emission reduction (i.e. the benefit of a CO2 reduction).
The SCC matters, as EPA notes, because they use it in their cost/benefit analysis and the larger the SCC, the easier it is for EPA and other agencies to justify more expensive regulation, regardless of the actual impact on global temperature.
The “Settled Science” Just Keeps Getting Worse
To get a sense of just how drastically the estimates of the SCC have changed in a mere three years, let’s do an apples-to-apples comparison of the 2010 Working Group’s numbers (summarized here) compared to the ones just released in May 2013:
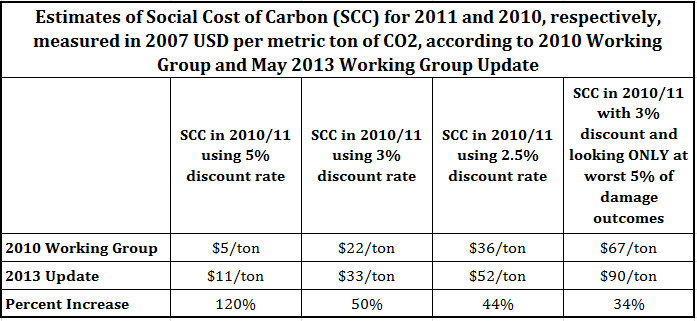
Note, the above comparisons actually (slightly) understate the inflation of the SCC over the last three years, because the 2010 Working Group’s numbers referred to the 2011 social cost of carbon, whereas the 2013 update refers to the 2010 estimate. (The social cost of carbon typically rises over time, as the modeled damages from an additional ton of emissions increase with more and more emissions.) As the above table illustrates, the latest White House “update” isn’t a minor tweaking of the numbers, polishing off a few decimal places, as it were. No, depending on which framing of “the” social cost of carbon we choose, the increase ranges from 34 percent up to a whopping 120 percent.
Often the climate change activists will tout revisions of this nature as further evidence that the (alleged) emergency is real. “See? We told you things were bad! We should’ve implemented a carbon policy years ago.”
Yet hang on a second. Suppose you were getting ready to take the first manned mission to Mars, which government scientists had been planning for years. Three years ago, they thought the trip would take a certain amount of fuel for the ship and oxygen for the crew, and planned accordingly. Now, they release a new estimate saying, “Whoops, we changed our computer simulation of your trip, and it turns out you’ll need 120 percent more fuel and oxygen than we thought. On this latest simulation, with the old numbers, you and the rest of the crew would suffocate before you even reached Mars.”
With that much volatility in the estimates, how much confidence do you have in these computer simulations? Are you anxious to put your life in the hands of scientists who change their estimate of key variables by 120 percent in a mere three years?
By the same token, the Administration is going to rely on estimates of the “social cost of carbon” to guide regulatory cost/benefit calculations. There are literally trillions of dollars in economic growth (over the coming decades) hanging in the balance on such numbers. The fact that the estimates are so over-the-map should give pause to the entire enterprise of using the SCC in regulatory cost/benefit analysis. This wild divergence shouldn’t be taken as evidence that the problem is in need of immediate government intervention. This is especially true once we explore further what these various categories from the above tables mean.
The Different Categories for the Social Cost of Carbon
As the table above shows, the estimate of the social cost of carbon (SCC) depends crucially on our framing decisions. In this respect, it’s not a natural constant such as the charge on an electron or the speed of light. No, the SCC for a particular year depends on how we deal with (a) the proper weighting of future events and (b) the proper weighting of uncertain events.
Whichever computer simulation one uses to model the effects of carbon dioxide emissions, the vast bulk of damages to humanity occur many decades in the future. Therefore, to assess the monetary estimate today of these (far-distant) events, we need to figure out how much a dollar in damages in, say, the year 2075 should compare to a dollar today. Just as a corporation wouldn’t borrow $1 million today to fund a project that will pay off $1 million in the year 2075, by the same token policymakers shouldn’t treat costs and benefits today on par with costs and benefits that our grandkids will experience. (The mainstream economic treatment of discounting is summarized nicely by William Nordhaus in this article where he criticized the huge estimates of the SCC contained in the Stern Review.)
There are various pros and cons for using one discount rate versus another, but the important point is that the lower the discount rate, the higher the estimated SCC will be. In the tables above, there is no difference in the modeled scenarios in the middle three columns, moving left to right. Those huge differences in the SCC are driven solely by changing the rate at which we discount future (modeled) damages from climate change. For example, according to the latest update from the Working Group, the SCC of an additional ton of emissions in 2010 would be $11 using a 5 percent discount rate, but it skyrockets to $52 using a 2.5 percent rate. To repeat, the only thing driving these different estimates (the ones in the middle three columns above) is the choice of discount rate; the underlying scenarios of physical climate change are the same in all three columns.
Anyone remotely familiar with industry knows that no private entity would embark upon a 100-year project earning only a 5 percent return, let alone a 2.5 percent return. In other words, the implicit discount used in the marketplace is much higher than any of the rates used by the Working Group in assessing the long-term “social cost of carbon.” For example, in writing this blog post I just googled “what discount rate does private sector use” and the top article was from an investor who used a 15 percent rate. Needless to say, at anything approaching that high of a discount rate, the Administration’s own preferred computer simulations would have a social cost of carbon that rounded off to zero for the next decade.
To see the dangers of using very low discount rates in the climate change literature, consider this quotation from some of the leading economists in the field:
[W]ith a very low discount rate, the social cost of carbon is arbitrary. We know this because the estimate does not converge as the time horizon expands. It follows that assumption about the remote future dominate the results; and since these assumptions are so uncertain, they are essentially arbitrary. [Bold added.][1]
But wait, it gets worse. What’s going on in the last column in the tables above? Here, the Working Group has focused just on the worst 5 percent of computer scenarios, and then (using a 3 percent discount rate) tells us what the social cost of carbon would be. The alleged justification for this odd procedure is that the standard cost/benefit approach leaves humanity vulnerable to catastrophic risks. Regardless of what one thinks of this move, we should be clear that the Working Group is throwing out conventional cost/benefit analysis, in order to come up with much higher damage estimates.
Getting Inside the Models
The Working Group bases its estimates on three independent computer simulations of the physical climate and global economy. These are the so-called DICE, PAGE, and FUND models. The reason for the huge jumps in the estimated social cost of carbon from 2010 to now, is that these underlying models have been tweaked in the intervening years
In the present blog post, it would be too wonkish to get hip-deep into the models and argue about the particular changes in question. Someone who wants to see that level of specificity should look at my journal article on the DICE model (based on its 2007 calibration). Such readers will discover that it is quite easy to get larger estimates of the “negative externality” of carbon emissions. All one has to do is brainstorm on the bad things that can happen, and not spend much time on the good things. For example, as I document in the paper, some of the published estimates of the net damages from further carbon emissions will include the loss of recreational snow skiing (because a warmer climate shortens the winter) but won’t include the benefits of a longer water skiing season. For another example, the catastrophic estimates of agricultural damages will assume that farmers stupidly continue to plant the same crops, rather than adapting to a change in climate.
Conclusion
The very concept of the “social cost of carbon” is not nearly as objective and scientific as, say, the charge on an electron. It is based on subjective human decisions as to which scenarios to include in the model, the discount rate to apply to future costs and benefits, and how to deal with uncertainty. Especially in light of the fact that these modeling choices keep pushing the official estimates up and up—more than doubling in some cases in just three years—one can’t help but wonder whether there is a desire to ease the case for political action at work. In any event, the public should realize just how “unsettled” the economic side of the carbon debate is. The estimates keep bouncing around all over the place, and the estimates are driven by very controversial parameter choices, not objective assessments given by physicists and climatologists.
[1] Anthoff, David; Tol, Richard S. J.; Yohe, Gary W (2009).”Discounting for Climate Change. Economics”. The Open-Access, Open-Assessment E-Journal, 3: 2009–2024.doi:10.5018/economics-ejournal.ja.2009-24.
