
On October 16, 1973, the Arab members of the Organization of Petroleum Exporting Countries (OPEC ) announced a decision to raise the price of oil by 70 percent a barrel, which was followed by the oil ministers agreeing to an embargo on oil shipped to the United States, a five percent reduction in production from September’s levels, and a continuation in production reductions in five percent increments until the organization’s economic and political objectives were met.The stated reason for the embargo on the United States was because the U.S. provided military supplies to aid Israel in the Yom Kippur War that Egypt and Syria launched against Israel on October 6, 1973.
While the war ended in the same month that it had started (October 1973), oil prices were raised dramatically to reduce demand to the new, lower level of supply. The market price for oil rose from $3 per barrel to almost $12 per barrel by January 1974. At that time, net imports of petroleum were supplying 35 percent of U.S. petroleum consumption. The embargo, combined with the perverse consequences from oil price controls introduced earlier by Nixon, meant that consumers had to wait for hours in long lines at gas stations, some of which were miles long. President Nixon asked homeowners to turn down their thermostats and for companies to cut back on work hours; and gas stations were asked to hold their sales to a maximum of ten gallons per customer.
In November 1973, President Nixon proposed an extension of Daylight Savings Time and a ban on the sale of gasoline on Sundays, both of which were approved by Congress. He also vowed that the United States should become energy independent within 7 years. On November 13, Congress approved a Trans-Alaskan oil pipeline, designed to move 2 million barrels of oil a day, so that Alaska’s North Slope could supply the lower 48 states with crude oil. The Trans-Alaskan pipeline system was completed in 1977. To hedge against any future crude oil supply interruptions, the United States created the Strategic Petroleum Reserve, which can hold more than 700 million barrels of emergency oil supply. And, in 1974, the Organization of Economic Cooperation and Development created the International Energy Agency to foster communication and strategy among countries.
By December, OPEC began to backtrack on its production cuts as its member countries were feeling revenue pressures. On March 18, 1974, OPEC lifted the embargo. But the embargo had a lasting impact: it introduced volatility into the oil market and made the world realize that geopolitics would play a more significant role in future oil supplies.
The goal of energy independence has not yet been achieved, but forecasters believe North American energy independence is not far away due to the energy resources of the United States and Canada and the ingenuity of its people. The purpose of this post is to compare the oil and natural gas situation in 1973 to what confronts us today and to explain why energy independence is within our reach.
Petroleum: 1973 versus 2012
Proved Oil Reserves
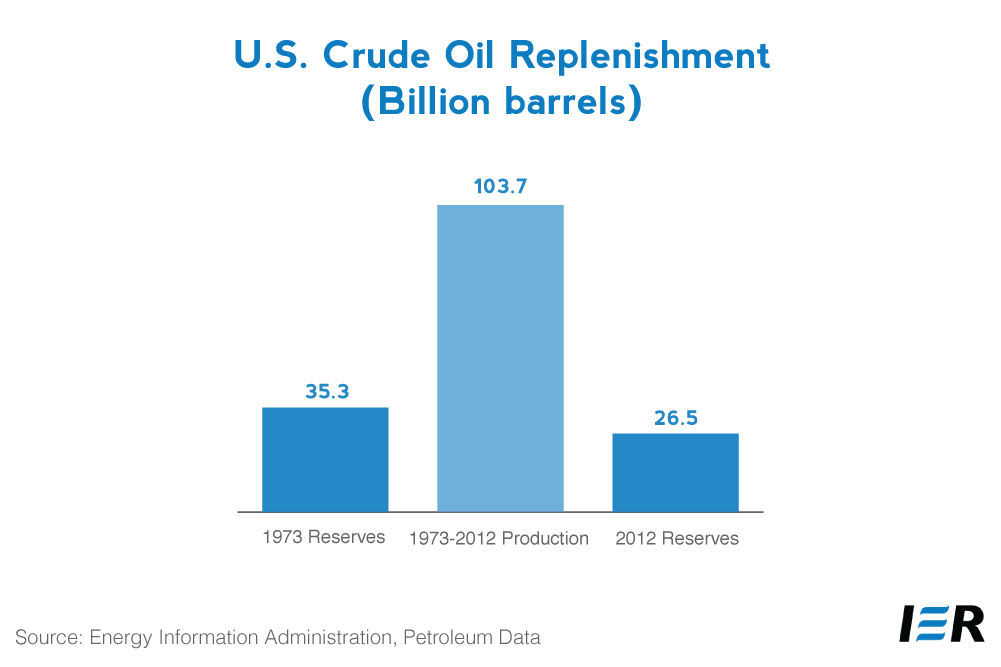
Oil reserves in the United States stood at 35 billion barrels in 1973, or about 5.5 years of supply at 1973 consumption rates. The latest data that the Energy Information Administration has for oil reserves is 26.5 billion barrels, or 3.9 years of supply at 2012 consumption rates for petroleum in the United States. However, because proved oil reserves is a but a small subcategory of our total oil reserves, we have much, more oil than what is currently categorized as proved. Currently, the United States has 1.442 trillion barrels of technically recoverable oil,[i] from which we add to our proved oil reserves, as new reserves are found and new technology is used to replenish them. As the next chart shows, the United States produced almost 104 billion barrels of oil between 1973 and 2012, almost 3 times as much as the reserves it had in 1973, and still had 26.5 billion barrels of reserves in 2012.
 Oil Production
In 1973, the United States was near its peak oil production, producing 9,208 thousand barrels per day. The peak had occurred 3 years earlier in 1970 and since then, crude oil production in the United States had been on a downward trend until 2008, after which a sharp uptick in production occurred. (See chart below.)
The uptick was a result of the shale oil boom in the United States from hydraulic fracturing and directional drilling technology. Texas with the Eagle Ford shale and North Dakota with the Bakken shale formation have increased production and reserves, with the United States producing 6,486 thousand barrels per day in 2012 and averaging 7,296 so far in 2013. While 2013’s production is 21 percent less than what was produced forty years ago, the trend is clearly now on an upward direction. Further, a new shale oil field in Texas, the Wolfcamp shale formation, is expected to hold 50 billion barrels of oil, making it the biggest oil field in the United States and the second largest in the world.
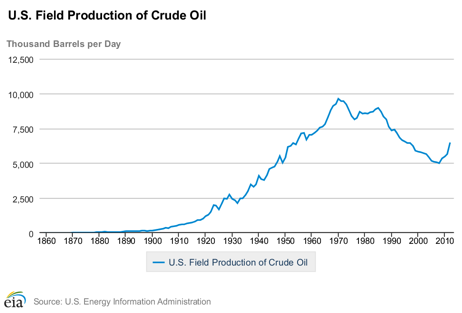
Source: http://www.eia.gov/dnav/pet/hist/LeafHandler.ashx?n=PET&s=MCRFPUS2&f=A
The hydraulic fracturing and shale oil revolution have made major changes in U.S. oil production. In 1973, North Dakota was not noted for its oil production. Now, it is the second largest oil producing state in the nation. North Dakota’s economy is growing at over 7 percent per year and its unemployment is around 3 percent—certainly envious numbers for many U.S. states. Further, the shale oil revolution has poised the United States to become the largest oil producer in the world, which the International Energy Agency predicts will occur by 2017.
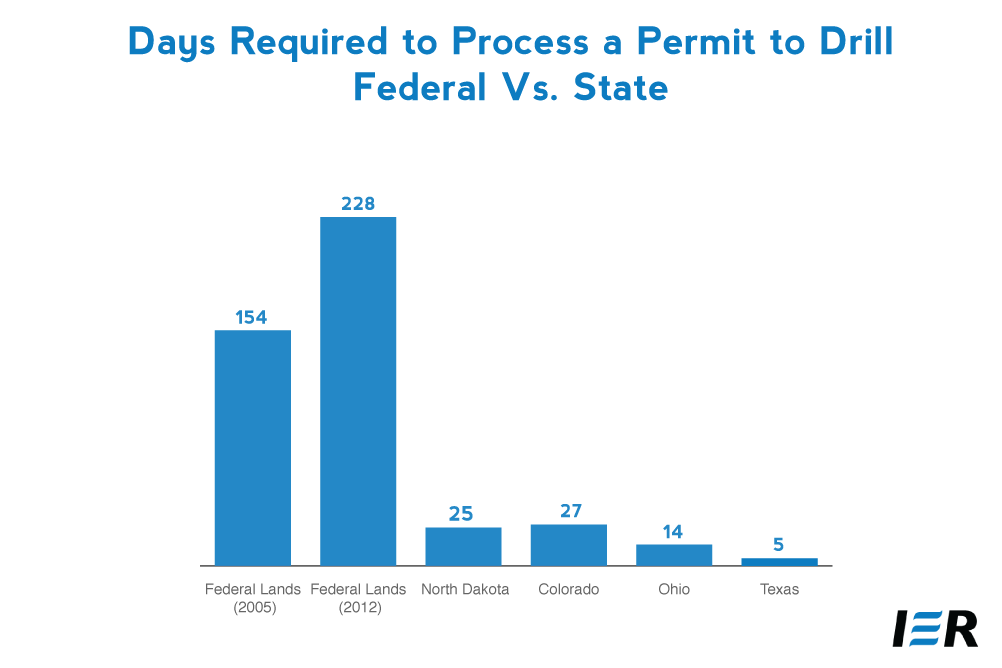
Although much of our natural resources are found on federal lands, the increase in oil production has been occurring mainly on private and state lands. Between fiscal year 2007 and 2012, oil production on private and state lands increased by 40 percent, while oil production on federal land declined by 23 percent.[ii] Oil companies prefer to drill for oil on private and state lands because there is a lot less red tape, and the state regulatory agencies work closely with the oil companies to provide certainty in the regulatory process. For example, the state of Texas processes a drilling permit in 5 days[iii], and North Dakota in 20 to 30 days, while the federal government’s Bureau of Land Management now takes over 200 days to process a permit, an increase of almost 50 percent since 2005.[iv] (See chart below.)
 Petroleum Consumption
Petroleum demand in the United States is on a downturn and has been since the recession that began in 2008 that dampened demand, the oil price spike that occurred in that year, and continued relatively high oil prices on world markets since then. (See chart below.) Since 2005, oil prices on the international market have been over $50 a barrel and have been over $100 a barrel since the end of 2010. The result of higher oil prices, which translate into higher gasoline prices (over $3 a gallon), is that Americans are driving less and consuming less petroleum. Future motor fuel demand will also be impacted by the Corporate Average Fuel Economy (CAFE) standard that the Obama Administration has raised to 54.5 miles per gallon by 2025, about twice its current level.
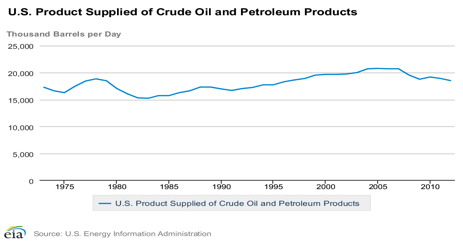
Source: Energy Information Administration, http://www.eia.gov/dnav/pet/hist/LeafHandler.ashx?n=PET&s=MTTUPUS2&f=
Net Petroleum Imports
Net petroleum imports, oil and petroleum product imports minus exports, was 35 percent of petroleum consumption in 1973, was slightly higher at 40 percent in 2012, and is 35 percent for the first 8 months of this year. The 2012 and 2013 shares represent a substantial decline from the high reached in 2005 at 60 percent. The reason for the decline is mainly due to increased production from the shale oil renaissance, but also due to the decline in petroleum consumption and increased production of biofuels (mainly corn-based ethanol) blended with motor fuels.
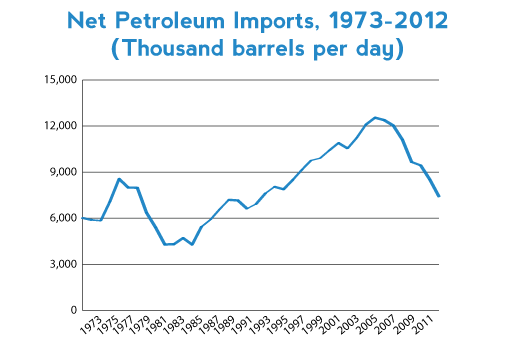 Source: Energy Information Administration, Monthly Energy Review, http://www.eia.gov/totalenergy/data/monthly/pdf/sec3_7.pdf
Our imports come from various sources, but Canada and Mexico have always provided oil to the United States during the last 40 years. In 1973, Canada supplied us with 21 percent of our petroleum imports. Over the last 40 years, Canada has more than doubled its annual petroleum exports to the United States, supplying us with 28 percent of our petroleum imports in 2012. In 1973, Mexico provided the United States with less than 1 percent of our petroleum imports, but in 2012, its share had increased to almost 10 percent. Over the last 40 years, OPEC’s share has declined from 48 percent of our imports to in 1973 to 40 percent in 2012. The top 10 suppliers of oil and petroleum products in 2012 were:
Top 10 U.S. Oil and Petroleum Product Import Suppliers — 2012
|
Country |
Thousand Barrels per Day |
|
Canada |
2,955 |
|
Saudi Arabia |
1,359 |
|
Mexico |
1,031 |
|
Venezuela |
952 |
|
Russia |
477 |
|
Iraq |
474 |
|
Nigeria |
441 |
|
Colombia |
432 |
|
Kuwait |
308 |
|
Algeria |
242 |
Source: Energy Information Administration, Monthly Energy Review, http://www.eia.gov/totalenergy/data/monthly/
As you can see from the above table, the United States does obtain oil from the Persian Gulf. In fact, between 1973 and 2012, those imports have increased by a factor of 2.5 and its share has increased from 14 percent to 20 percent. But the United States can become independent of these imports due to our vast oil shale and shale oil resources in the United States and due to Canada’s vast reserves of oil sands. What we need is for our federal government to literally get out of the way of their development by approving the Keystone pipeline that crosses the border of the U.S. and Canada and to lease our oil shale resources, which first have been delayed and then stopped by the Obama Administration. Also, it would be helpful for the federal government to allow more oil production both onshore and offshore Alaska. Increasing Alaskan production would reduce the need for refineries on the west coast to import oil from overseas, as they are increasingly doing.
The International Energy Agency (IEA) predicts that the United States will become a net oil exporter by 2030 and will become almost self-sufficient in energy by 2035. The IEA has even hinted that this newly found U.S. energy independence could redefine military alliances, with Asian nations, instead of the United States, needing to secure oil shipping lanes.[v] In fact, the United States is no longer the leading net oil importer since China has recently surpassed us.
Natural Gas: 1973 versus 2012
In 1973, President Nixon probably did not consider natural gas as a vulnerable energy source since our domestic production was peaking at that time and our imports were coming from Canada at less than 5 percent of consumption. But, shortly thereafter, natural gas shortages resulted from the same regulation and price controls that the federal government had inflicted on oil. Once the price controls were eliminated, an oversupply of natural gas resulted in what was termed the ‘gas bubble’, proving that market forces and price signals work if allowed, without unnecessary intervention from the government.[vi]
Before the shale gas revolution hit much later, it was believed that the United States would not only need natural gas imported from Canada and Mexico, but also liquefied natural gas (LNG) from abroad. LNG terminals were built to obtain that gas and natural gas prices had escalated. The shale gas revolution, however, has changed that—the United States now leads the world in natural gas production, applications are being reviewed to export LNG, and natural gas prices have tumbled.
Natural Gas Proved Reserves
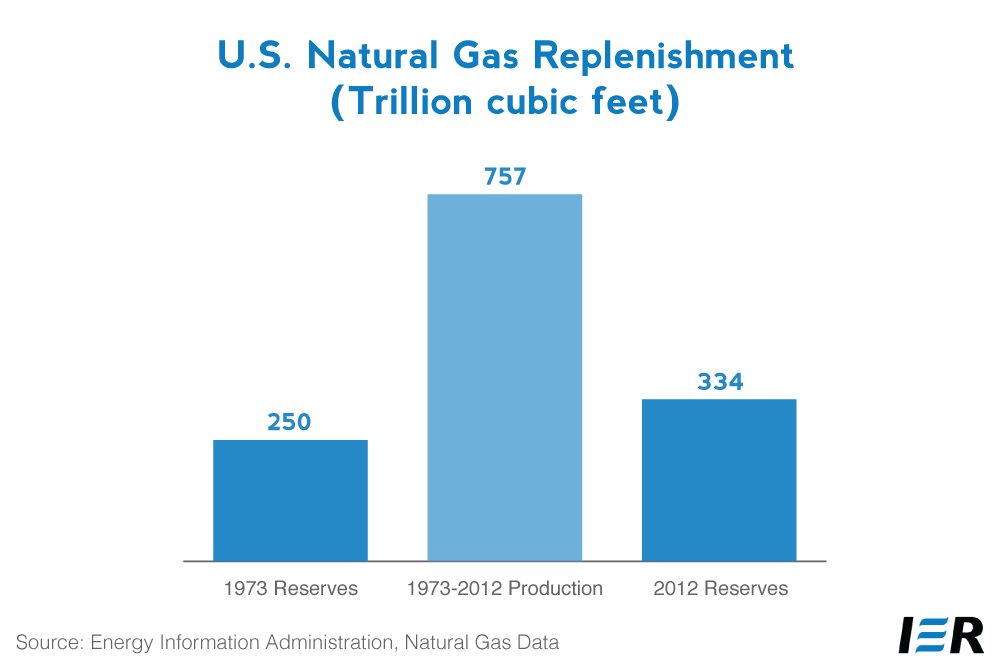
Proved reserves of natural gas have increased dramatically between 1973 when they totaled 250 trillion cubic feet and 2012 when they totaled over 30 percent more (334 trillion cubic feet), despite the fact that the oil and natural gas industry produced over 757 trillion cubic feet of natural gas in that 40 year period. The reason is that reserves are replenished from technically recoverable natural gas that is estimated to total 2,744 trillion cubic feet, more than 100 years of natural gas at 2012 natural gas consumption levels.
Natural Gas Production
1973 marked a year of peak historical production for natural gas at 21.73 trillion cubic feet. While natural gas production declined somewhat after that, it began to increase again after 2005, and has reached a new peak in 2012 of 24.06 trillion cubic feet. The United States is now the largest natural gas producer in the world, a recognition it has held for over 2 years. It owes that recognition to the hydraulic fracturing and horizontal drilling technologies that have combined to make shale gas production a reality. The Marcellus shale formation that extends from New York to Ohio and being produced mainly in Pennsylvania is supplying surrounding states with natural gas at much reduced prices. Wellhead prices averaged $2.66 per thousand cubic feet in 2012, 67 percent lower than in 2008, when they peaked at $7.97 per thousand cubic feet. Of course, that is still a lot higher than natural gas wellhead prices were in 1973 at $0.22 per thousand cubic feet.
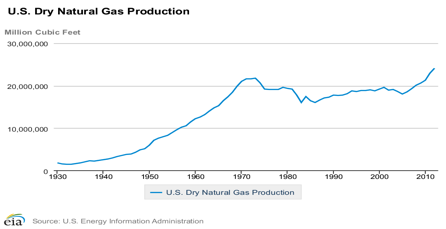
Source: Energy Information Administration, http://www.eia.gov/dnav/ng/hist/n9070us2a.htm
Natural Gas Consumption
Due mainly to the lowered prices, natural gas consumption has increased in recent years, making in-roads to coal’s domination of the electric generating market and bringing back to the United States manufacturing industries that had moved offshore. Also helping natural gas to increase market share in the electric generating market are regulations affecting coal use promulgated by the Environmental Protection Agency. Coal’s share has declined from 50 percent of the electric generating market in 2005 to under 40 percent in 2012, while natural gas’ share has increased from 19 percent to 30 percent of the generation market over that time period. Natural gas is said to be favored as a bridge fuel by environmentalists because it has half the carbon dioxide emissions of coal.
In 1973, natural gas consumption stood at 22 trillion cubic feet and then began to decline until 1986, when it started to increase steadily. In 2012, it was at a record level of 25.5 trillion cubic feet. (See graph below.)
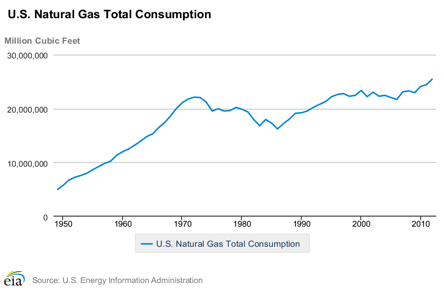
Source: Energy Information Administration, http://www.eia.gov/dnav/ng/hist/n9140us2a.htm
Natural Gas Imports and Exports
The United States imports natural gas by pipeline from Canada and Mexico and some liquefied natural gas (LNG) from foreign countries. LNG imports peaked in 2007 and have since declined by 77 percent due to the shale gas revolution. Now, rather than importing liquefied natural gas, the United States is looking to sell it abroad. Companies seeking to export liquefied natural gas to countries that do not have a free-trade agreement with the United States must first obtain approval from the U.S. Department of Energy (DOE). DOE has approved some applications and others are pending.
Imports of natural gas from Canada have also declined, by 22 percent between 2007 and 2012. They now total 2.96 trillion cubic feet. Imports of natural gas from Mexico have also declined since 2007, but they represented only a small share of the total natural gas import market.
Natural gas imports totaled 4.6 trillion cubic feet in 2007 when they reached their peak, and have declined since by 32 percent totaling 3.1 trillion cubic feet in 2012. (See chart below.)
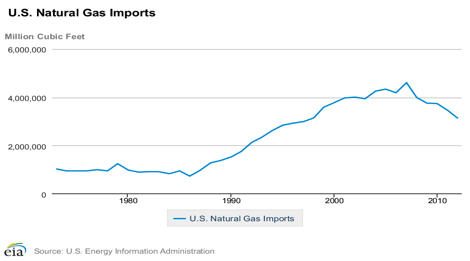
Source: Energy Information Administration, http://www.eia.gov/dnav/ng/hist/n9100us2a.htm
Conclusion
Between October 1973 and January 1974 world oil prices quadrupled. By putting an end to decades of cheap energy, the 1973-74 oil crisis, which was led by the Arab members of OPEC, changed the geopolitical outlook regarding future energy supplies. It also fostered a new found interest in government involvement in energy markets and setting energy policies. But, the government policies just seemed to make the problems worse, with oil imports rising to 60 percent by 2005. The recent past has shown us that the only real improvements in our energy picture come not from the government, but despite it.
Much has happened over the past 40 years regarding oil and natural gas production in the United States. The United States is once again the leading producer of natural gas in the world and is expected to be the leading producer of oil in the near future. The change is the result of the shale oil and gas revolution and the advent of hydraulic fracturing and horizontal drilling technologies that make shale oil and gas production feasible. After decades of different government energy policies, Americans are benefitting from the private sector, private investment, human ingenuity and the involvement of the states that are not tied to Washington decision making.
President Nixon’s goal of achieving energy independence, or at least North American energy independence, and along with it increased economic growth and security, is within our reach, but we need access to our vast natural resources and to Canada’s rich supply of oil sands, which the federal government is currently denying us. After forty years of mostly bad energy policy, Americans are seeing good energy results that did not come from the federal government.
[i] Institute for Energy Research, North American Energy Inventory, December 2011, http://www.energyforamerica.org/wp-content/uploads/2012/06/Energy-InventoryFINAL.pdf
[ii] Congressional Research Service, U.S. Crude Oil and Natural Gas Production in Federal and Non-Federal Areas, March 7, 2013, http://energycommerce.house.gov/sites/republicans.energycommerce.house.gov/files/20130228CRSreport.pdf
[iii] Oil & Gas Journal, World Hydrocarbon Supply ‘Relatively Boundless’, September 30, 2013, http://www.ogj.com/articles/print/volume-111/issue-9d/general-interest/world-hydrocarbon-supply-relatively-boundless.html
[iv] Lynn D. Helms, Summary of Testimony by Lynn D. Helms, Director North Dakota Industrial Commission, Department of Mineral Resources, Aug. 2, 2012, http://democrats.energycommerce.house.gov/sites/default/files/image_uploads/Helms.Testimony.pdf
[v] Wall Street Journal, Shale Boom to Turn U.S. Into World’s Largest Energy Producer, Watchdog Says, November 12, 2012, http://professional.wsj.com/article/SB10001424127887323894704578114492856065064.html?mg=reno64-wsj
[vi] Wall Street Journal, Daniel Yergin: Why OPEC No Longer Calls the Shots, October 14, 2013, http://online.wsj.com/article/SB10001424052702303382004579131460420974406.html
