
According to BP’s Statistical Review of World Energy[i], global coal production dropped by 6.5 percent in 2016 with a slower drop in global coal consumption of 1.7 percent. Coal consumption was 2.1 percent higher than coal production in 2016, lowering the level of global coal stocks. China, the world’s largest energy consumer and emitter of greenhouse gases, consumed the less coal in 2016 than in any of the previous six years, dropping its consumption by 1.6 percent from the previous 2015. In the United States, coal consumption dropped by over 8 percent to a level last seen in the early 1980s. Not all countries lowered their coal use, however. Turkey and the Ukraine, for example, increased their use of coal, as did Indonesia and some other Asian countries.
Coal’s share of the energy market dropped from 28.9 percent in 2015 to 28.1 percent in 2016, but it still remained the number two fuel of choice among the world’s economies.
BP also noted that global carbon dioxide emissions stayed fairly flat over the past 3 years, growing at only 0.1 percent in 2016. U.S. carbon dioxide emissions were down by 2.0 percent and China’s carbon dioxide emissions were down 0.7 percent, but remained over 70 percent higher than those of the United States. India, the world’s third largest emitter increased its carbon dioxide emissions by 5.0 percent (113.7 million metric tons)—the largest quantitative increase of any country. The chart below depicts the growing carbon dioxide emissions in Asia as those countries become more industrialized.
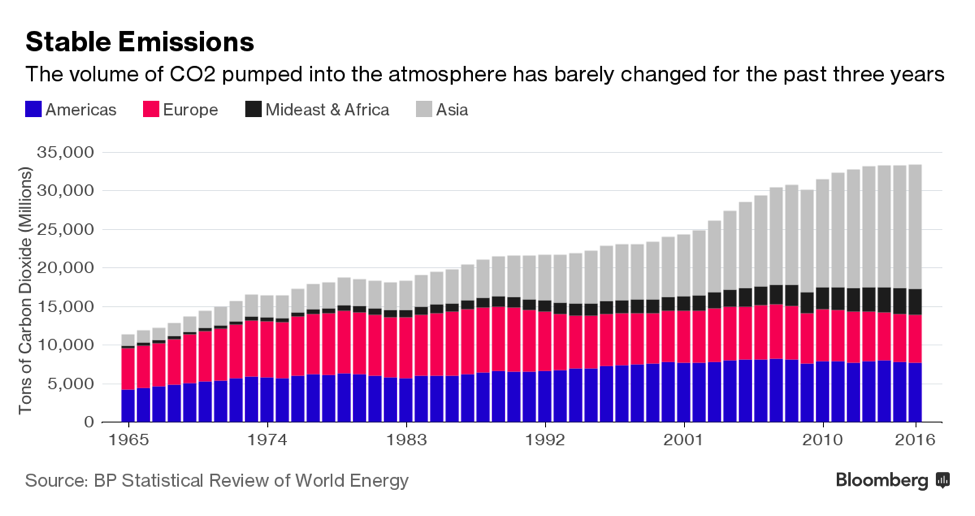
Source: Bloomberg
Global Energy Demand
In 2016, global energy demand was weak, growing by just 1 percent, about half the average growth rate of the past decade. Almost all the growth came from fast-growing developing economies, with China and India together accounting for half of the growth.
Energy demand in India increased 5.4 percent and in China 1.3 percent—about a quarter of its 10-year average growth rate. The increase in demand in China, however, made it the world’s largest energy growth market for the 16th consecutive year.
Oil Production and Consumption
Global oil production increased 0.5 percent in 2016 while consumption rose 1.6 percent, exceeding the ten-year rate of growth of 1.2 percent. Oil consumption was 4.8 percent higher than production, reducing oil inventories. India’s oil consumption increased 7.8 percent (by 325,000 barrels a day), and China’s increased 3.3 percent (by 395,000 barrels per day). U.S. oil demand increased by 0.5 percent (100,000 barrels per day). Demand from the Organization for Economic Cooperation and Development (OECD), a group of industrialized nations, grew 0.9 percent in 2016, compared to a 2.3 percent increase in the oil demand of non-OECD countries.
Weak oil prices affected the growth in oil production—an increase of just 446,000 barrels per day. Production from OPEC grew by 1.2 million barrels per day (3.2 percent), with considerable increases from Iran (703,000 barrels per day), Iraq (434,000 barrels per day) and Saudi Arabia (363,000 barrels per day). Non-OPEC oil production decreased by 780,000 barrels per day (1.5 percent). The largest declines in oil production were in the United States (down 403,000 barrels per day), China (down 310,000 barrels per day) and Nigeria (down 276,000 barrels per day).
Natural Gas Production and Consumption
In 2016, global natural gas consumption increased by 1.5 percent—slower than the 10-year average rate of 2.3 percent. There was strong growth in natural gas consumption in the European Union (up 7.1 percent), the Middle East (up 3.5 percent) and China (up 7.7 percent).
Global natural gas production rose by just 0.3 percent. This was the weakest growth in natural gas production in 34 years, outside the financial crisis in 2008. Lower gas prices resulted in decreased natural gas production that fell for the first time since the shale gas renaissance began. Australian gas production increased by 25 percent, however, as new LNG facilities were commissioned. LNG production is expected to increase as additional new LNG projects are brought online.
Non-hydroelectric Renewable Energy
The supply of wind, solar and other non-hydroelectric renewable energy sources increased by a combined 14 percent in 2016, but represented just 3.2 percent of the global energy mix. Wind grew by almost 16 percent and solar power grew by almost 30 percent in 2016. According to BP, China slightly surpassed the United States last year as the world’s biggest non-hydroelectric renewable power producer. The Asia Pacific region and the Europe & Eurasia region were the largest producing regions for non-hydroelectric renewable power.
Nuclear Power
In 2016, nuclear power generation increased by 1.3 percent—51.2 terawatt hours. China’s nuclear output accounted for almost all the growth in nuclear power, increasing by 24.5 percent. China’s incremental growth in nuclear power was the largest from any country since 2004. Belgium increased its nuclear power generation by 66 percent in 2016—by 17.4 terawatt hours. The United States is still the largest generator of nuclear power in the world.
Hydroelectric Generation
Hydroelectric power generation increased by 2.8 percent in 2016—increasing by 119.6 terawatt hours. The largest incremental increases came from China and Brazil.
Conclusion
While markets somewhat shifted in 2016, it is not clear how much is structural and whether the change will persist. What is clear is that despite non-hydroelectric renewables growing at a double digit pace, they still do not make up much of the energy market (just 3.2 percent), while fossil fuels remain dominant, making up 86 percent of the global market in 2016.
[i] BP Statistical Review of World Energy 2017, http://www.bp.com/en/global/corporate/energy-economics/statistical-review-of-world-energy/using-the-review/downloads.html
