
Coal-fired electricity generation is significantly cleaner today than it was in the past. The popular misconception that our air quality is deteriorating is incorrect, as evidenced by the Environmental Protection Agency’s (EPA) air quality data, which indicates the opposite. Emissions from the criteria pollutants released from U.S. fossil fuel power plants have decreased as technology has improved and will continue to do so. Modern coal plants, and those retrofitted with control technologies to reduce criteria pollutants, are a success story and are currently providing 15 percent of our electricity, down from over 50% in 2000 due to onerous regulations targeting coal, competition from low-cost natural gas, and massive federal subsidies for wind and solar power plants.
Executive Summary
America’s improving air quality is an untold success story. Even before Congress passed the Clean Air Act Amendments of 1970, air quality had been improving for decades. And since 1970, the six so-called criteria pollutants have declined significantly, even though our coal-fired plants have generated as much as 52% of U.S. electricity, and are still providing 15%. The “criteria pollutants” are carbon monoxide, lead, sulfur dioxide (SO2), nitrogen oxides (NOx), ground-level ozone, and particulate matter (PM). They are called “criteria” pollutants because the EPA sets the criteria for permissible levels.
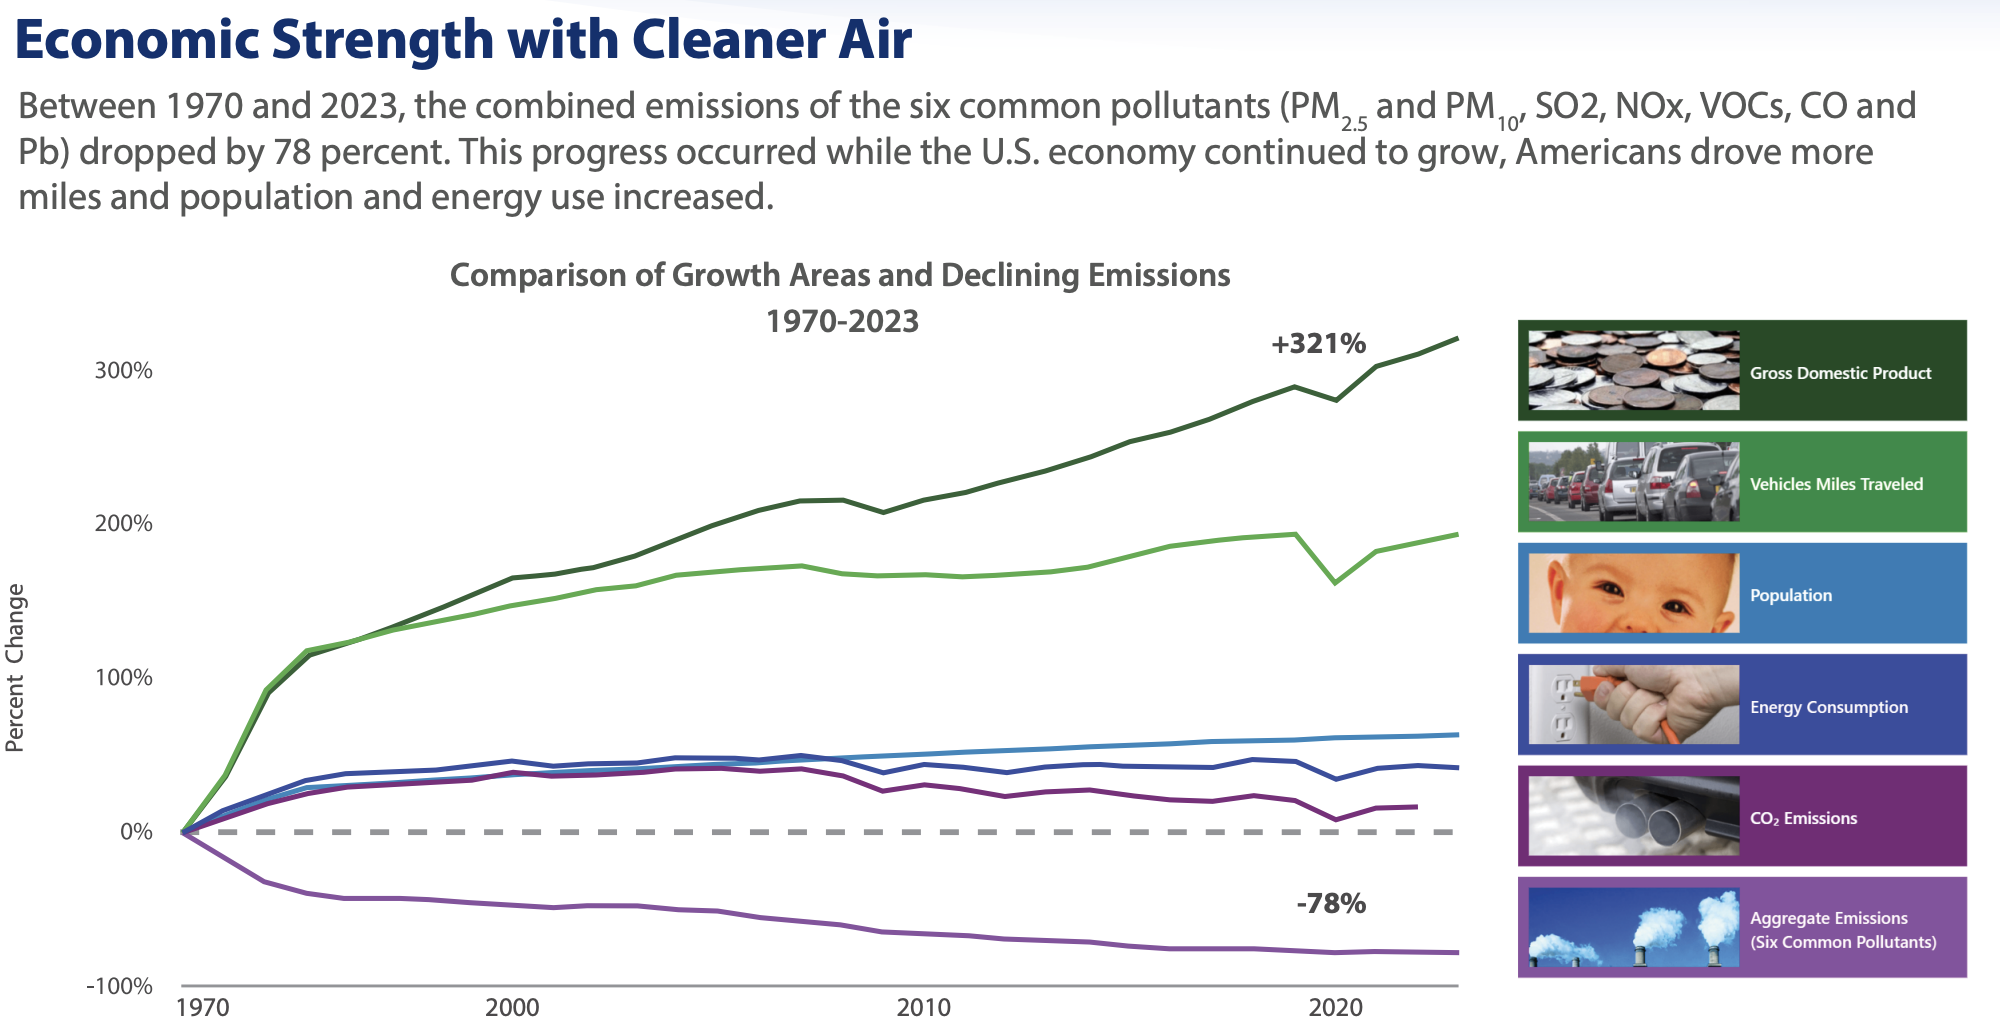
Between 1970 and 2023, the combined emissions of the six common pollutants (PM2.5 and PM10, SO2, NOx, VOCs, CO, and Pb) dropped by 78%. This progress occurred while U.S. economic indicators remained strong; the economy improved by 321%, Americans drove more miles (194%), the population increased by 63%, and energy use increased by 42%, all while the environment became cleaner. The graph below also shows that carbon dioxide emissions, after having risen gradually for decades, have decreased since 2007.
One factor in improving air quality has been the pollution-control technologies used by coal-fired power plants. Today’s coal-fired electricity generating plants produce more power with less emissions of criteria pollutants than ever before. According to the National Energy Technology Laboratory (NETL), a new pulverized coal plant (operating at lower, “subcritical” temperatures and pressures) reduces the emission of NOx by 83 percent, SO2 by 98 percent and PM by 99.8 percent, as compared with a similar plant having no pollution controls. Air quality will continue to improve in the future because of improved technology.
Today, coal-fired electricity generation produces 15 percent of the electricity generated in America and provides many jobs. For example, Prairie State Energy Campus, a two-unit 1,600-megawatt supercritical coal plant operating since 2012 in southern Illinois, generates clean electricity by using five technologies: nitrogen oxide controls, Selective Catalytic Reduction, dry electrostatic precipitators, sulfur dioxide scrubbers, and wet electrostatic precipitators, at a cost of $1 billion. Six and a half million tons of coal are mined a year at a coal mine adjacent to the power plant. Between the power plant, coal mine, and other assets, the campus is projected to inject over $22 billion into the regional economy over the next 30 years, employing 309 workers. Due to its environmental control technologies, the plant emits 80% less criteria pollutants, delivering electricity to 2.5 million homes in eight states. Because it is a base load plant, it can operate around the clock and be responsive to demand for power from consumers, unlike inherently intermittent plants such as wind and solar. Because of its supercritical steam generators and not needing to transport coal, the company expects a 15% reduction in carbon dioxide emissions compared with other coal-fired power plants.
According to the Statistical Review of World Energy 2024, in 2023, coal represented 26% of the world’s energy consumption, but just 9% of the total energy consumption in the United States, as Obama and Biden’s climate policies and competition from low-cost natural gas reduced its U.S. share. Globally, coal was second only to oil, which had a 32% world share. About 35% of the world’s electricity was generated from coal in 2023 as developing countries continue to see coal as a way to bring power to their residents and grow their economies. In the United States, coal supplied just 16% of its electricity that year.
Background
Even before Congress passed the Clean Air Act Amendments of 1970, creating the Environmental Protection Agency, air quality was improving. Prior to 1970, businesses saw certain types of pollution as waste and worked to reduce it through technological improvements to increase efficiency. State and local policymakers also worked to reduce pollution.
The Clean Air Act requires the EPA to set National Ambient Air Quality Standards to control pollutants considered harmful to public health or the environment: these are the so-called criteria pollutants. Two of these pollutants, SO2 and NOx, are the principal pollutants that cause acid precipitation (colloquially known as acid rain). SO2 and NOx emissions react with water vapor and other chemicals in the air to form acids that fall back to earth. Before controlling for these emissions, power plants produced most (about two-thirds) of the SO2 emissions in the United States. The majority (about 50%) of NOx emissions came from cars, buses, trucks, and other forms of transportation, with power plants contributing about 25%. The remainder came from different sources, such as industrial and commercial boilers.
The Clean Air Act was modified in 1990. It introduced a cap on the total amount of SO2 emissions that may be emitted by electric power plants nationwide, thereby reducing the level of these emissions in the atmosphere. The approach used for compliance was a cap-and-trade program. To comply with the Clean Air Act Amendments of 1990, electric utilities could either switch to lower sulfur coal, add equipment (e.g., scrubbers) to existing coal-fired power plants that removes SO2 emissions, purchase permits from other utilities that exceeded the reductions needed to comply with the cap, or use other means of reducing emissions below the cap, such as operating high-sulfur units at a lower capacity utilization.
The Clean Air Interstate Rule in the Clean Air Act addresses interstate transport of air emissions from power plants. It was replaced by the Cross-State Air Pollution Rule (CSAPR). Under CSAPR, 27 states must restrict emissions of SO2 and NOx, which are precursors to fine particulate matter (PM2.5) and ozone-forming. CSAPR establishes four allowance-trading programs for SO2 and NOx, composed of different member states, based on each state’s contribution to downwind nonattainment of the National Ambient Air Quality Standards. In addition, CSAPR splits the allowance-trading program into two regions for SO2, Group 1 and Group 2, and trading is permitted only between states within a group but not between groups. On March 15, 2021, the EPA finalized an update to the CSAPR to require additional emissions reductions of NOx from power plants in 12 states and to revise the budgets for their emissions from 2022 to 2024. However, the U.S. Supreme Court issued a stay on implementing the Biden administration changes that would have been introduced through the EPA’s 2023 Good Neighbor Plan to revise NOx standards further.
In addition to the interstate transport rule, the Clean Air Act Amendments of 1990 introduced the requirement for existing major stationary sources of NOx located in nonattainment areas to install and operate NOx controls which meet “Reasonably Available Control Technology” (RACT) standards. To implement this requirement, the EPA developed a two-phase NOx program, with the first set of RACT standards for existing coal plants applied in 1996 while the second set was implemented in 2000. Dry bottom wall-fired and tangential-fired boilers, the most common boiler types, are referred to as Group 1 Boilers and were required to make significant reductions beginning in 1996 and further reductions in 2000. Relative to their uncontrolled emission rates, which range roughly between 0.6 and 1.0 pounds per million Btu, they are required to make reductions between 25 percent and 50 percent to meet the Phase I limits and further reductions to meet the Phase II limits. All new fossil units are required to meet current standards. In pounds per million Btu, these limits are 0.11 for conventional coal, 0.02 for advanced coal, 0.02 for combined cycle, and 0.08 for combustion turbines.
In April 2024, the EPA finalized its Section 111 of the Clean Air Act (CAA) regulating CO2 emissions from existing coal, oil, and natural gas-fired steam generating units and new natural gas-fired combustion turbines. The ruling requires existing steam turbines at coal-fired power plants to either convert to a natural gas-fired steam unit or cofire with at least 40% natural gas by 2030 if the units are intended to operate until January 1, 2039, or they must be retrofitted with a carbon capture and sequestration (CCS) system with a 90% capture rate by 2032 if they are intended to operate beyond January 1, 2039; otherwise, they must retire.
EPA also revised carbon pollution standards for new, modified, and reconstructed power plants under CAA Section 111(b). The emission rate for newly constructed coal steam units maintains the 2015 standard of 1,400 pounds of CO2 per megawatt hour, which requires at least partial sequestration. The 2024 rule also created different categories for compliance with new natural gas-fired technologies. Plants that intend to run as base load (greater than 40% capacity factor) must operate with 90% CO2 capture by 2032, while plants operating at intermediate or low load levels have standards consistent with current efficient designs and use of low-emitting fuel.
The Mercury and Air Toxics Standards rule (MATS) was finalized in December 2011 to fulfill the EPA’s requirement to regulate mercury emissions from power plants. MATS also regulates other hazardous air pollutants (HAP) such as hydrogen chloride and PM2.5. MATS applies to coal and oil-fired power plants with a nameplate capacity greater than 25 megawatts, and it requires that all qualifying units achieve the maximum achievable control technology (MACT) for each of the three covered pollutants by 2016.
Power plants are required to reduce their mercury emissions to 90 percent below their uncontrolled emissions levels. When plants alter their configuration by adding equipment such as a Selective Catalytic Reduction to remove NOx or an SO2 scrubber, mercury removal is often a resulting co-benefit. Plants can also add activated carbon injection systems specifically designed to remove mercury. Activated carbon can be injected in front of existing particulate control devices, or a supplemental fabric filter can be added with activated carbon injection capability.
The Biden EPA strengthened the MATS requirements on April 25, 2024, further limiting the emission of non-mercury HAP metals from existing coal-fired power plants by significantly reducing the emission standard for filterable particulate matter (fPM), which is designed as a surrogate emission standard to control non-mercury HAP metals. EPA finalized a two-thirds reduction in the fPM standard from 0.030 pounds per million British thermal units of heat input (lb/MMBtu) to 0.010 lb/MMBtu. EPA also tightened the emission standard for mercury for existing lignite-fired power plants by 70%.
Utility Industry Emission Equipment and Reductions
The Energy Information Administration provides the number of units that have control technology and their associated net summer capacity. In 2023, 521 units (167,232 megawatts) have flue gas desulfurization equipment (scrubbers), 621 units (171,029 megawatts) have electrostatic precipitators, 454 units (89,970) have fabric filters (baghouses), 1,383 units (346,601 megawatts) have selective catalytic and non-catalytic reduction systems, 344 units (110,996 megawatts) have advanced carbon injection systems, and 98 units (21,257 megawatts) have direct sorbent injection systems.
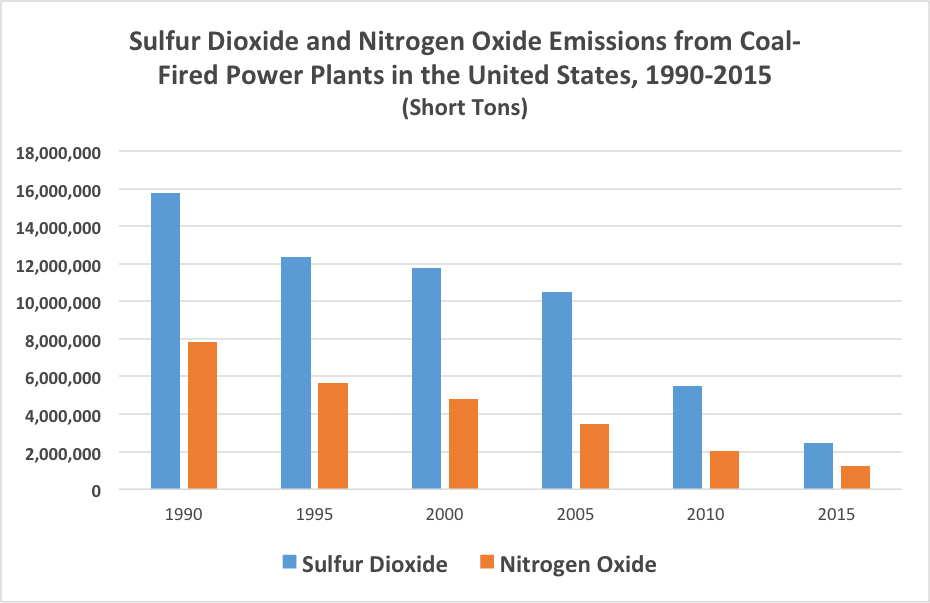
Between 2013 and 2023, SO2 emissions from U.S. power plants were reduced by 77%, and NOx emissions were reduced by 48%. The reductions are even more stark if we compare them to 1989 levels. Between 1989 and 2023, SO2 emissions from U.S. power plants were reduced by 95%, and NOx emissions were reduced by 86%.
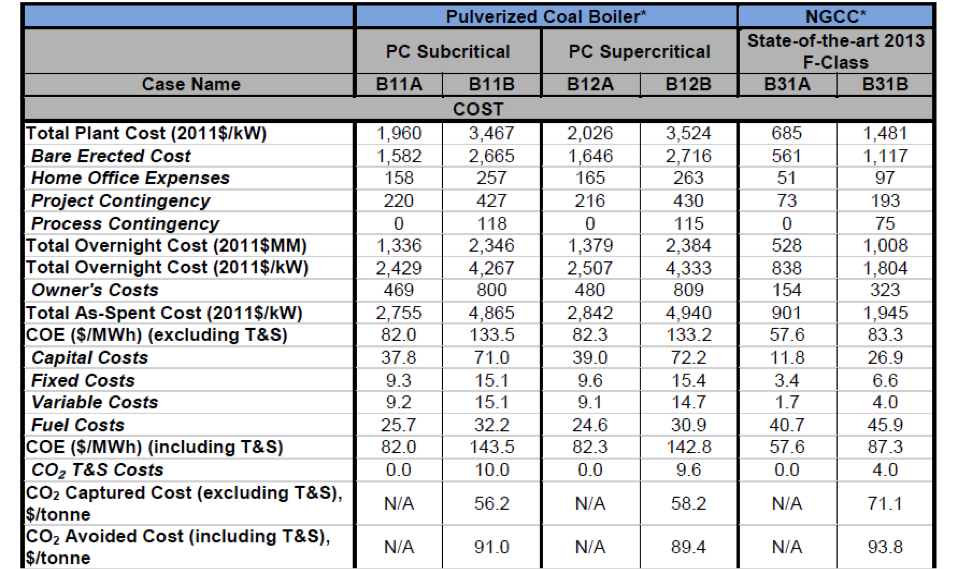
A study by NETL compared the emission rates from pulverized coal plants and integrated gasification combined cycle plants based on environmental regulations to control SO2, nitrogen oxide NOx, mercury, PM and CO2 at a greenfield site, assuming capacity factors of 85 percent, which would require the plants to be at the top of the dispatch order. Mercury, SO2, NOx, and PM are controlled with dry sorbent injection, activated carbon injection, wet flue gas desulfurization (FGD), low NOx burners, Selective Catalytic Reduction (SCR), and a baghouse, respectively. All of the power plant configurations with carbon capture are designed to achieve 90 percent capture. Integrated gasification units have lower levels of emissions than pulverized coal plants.
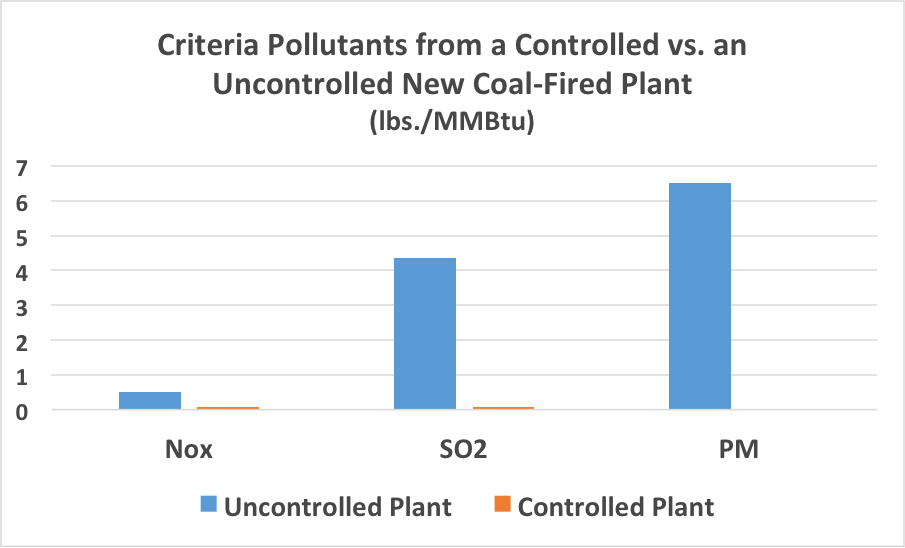
According to NETL, for a new pulverized coal plant (subcritical), pollution controls reduce NOx emissions by 83 percent, SO2 emissions by 98 percent, and PM by 99.8 percent compared to a similar plant with no pollution controls. The target emission level for NOx is 0.085 lb/MMBtu, for SO2 is 0.085 lb/MMBtu, and for PM is 0.011 lb/MMBtu. Without control technologies, a subcritical coal plant would emit 0.5 lb/MMBtu of NOx, 4.35 lb/MMBtu of SO2, and 6.5 lb/MMBtu of PM. The figure below depicts the criteria pollutants from a new controlled plant vs. a new uncontrolled plant.
Costs for Environmental Equipment
According to the EIA, the costs of adding FGD equipment to remove sulfur dioxide, in 2024 dollars, range from $1,175 per kilowatt for a unit less than 100 megawatts to $529 per kilowatt for a unit 700 megawatts or larger. The costs for SCR equipment to remove nitrogen oxides range from $476 per kilowatt for a unit less than 100 megawatts to $271 per kilowatt for a unit that is 700 megawatts or larger. The costs for fabric filters (FF) range from $333 per kilowatt for a unit less than 100 megawatts to $182 per kilowatt for a unit that is 700 megawatts or larger. The costs per megawatt of capacity decline with plant size, which is an argument for the economics of larger units. FGD units are assumed to remove 95 percent of the SO2, and SCR units are assumed to remove 90 percent of the NOx.
Coal Plant Retrofit Costs

Coal-fired electricity generation is far cleaner today than ever before. The popular misconception that our air quality is getting worse is wrong, as shown by the EPA’s data. Modern coal plants, and those retrofitted with modern technologies to reduce criteria pollutants, are a success story and are currently providing about 15 percent of our electricity and can be depended upon as a base load source. Criteria pollutants from coal-fired power plants will continue to fall as technology improves.
Cap-and-Trade: “Acid Rain” versus Greenhouse Gases
The results of using a cap-and-trade system to fight “acid rain” have led some to argue that it is a model for efforts to reduce carbon dioxide emissions. But the analogy fails. Stark differences exist between the “acid rain” emission-reduction program and the challenge of reducing carbon dioxide, a natural byproduct of combustion, emitted by natural and man-made sources.
Carbon dioxide is emitted in the United States by hundreds of millions of sources, including personal automobiles, the appliances many use to cook their food and heat their homes, and the businesses upon which we depend for our livelihoods, to name a few. Natural processes, in fact, emit most carbon dioxide. In contrast, the “acid rain” emission reduction program was initially limited to 110 site-specific utility plants, and then later expanded to additional coal plants. Carbon dioxide is a worldwide byproduct of combustion, whereas all criteria pollutants are local or regional. In other words, what the United States did for SO2 and NOx directly affected air quality here, while state, local, or national action to limit carbon dioxide emissions will have little bearing on aggregate global emissions.
Furthermore, at the time of the SO2 and NOx reduction program, alternative low sulfur coal sources existed and utilities had available affordable and proven technologies to reduce their emissions. When Congress passed the Clean Air Act Amendments of 1990, coal-fired utilities could responsibly reduce emissions from their plants using various options that limited cost impacts to the consumer and the nation.
In contrast, the major technology for utilities to reduce CO2 emissions from fossil fuel power plants is carbon capture and sequestration — a technology that is not commercially available and economically feasible for utility-scale generating units. Instead, to reduce CO2 emissions, utilities must prematurely retire their fossil fuel generating units and replace them with renewable technologies such as wind and solar power. Federal subsidies and state mandates have spurred the addition of these intermittent technologies, which now represent 16% of U.S. generation. However, these weather-driven technologies are not totally green in that they require large amounts of energy to manufacture and, in the case of wind, tons of cement to ensure their stability on the ground. Most of our solar cells come from China, which uses cheap coal power to make polysilicon, a significant ingredient in producing solar cells. Wind and solar power also require vast amounts of land and expensive storage batteries to back them up when the wind is not blowing and the sun is not shining.
The United States has reduced its CO2 emissions from the generating sector by over 40% since 2005 based on the premature retirements of coal plants and replacement by gas-fired units and wind and solar power that have increased average residential electricity prices by 74% since 2005. During Biden’s presidency, average residential electricity prices increased 25% — a third of the 20-year increase — due to his climate legislation and regulations. States with cap-and-trade programs and other laws to reduce greenhouse gas emissions saw even larger price increases.
A study in 2009 by Laurie Williams and Allen Zabel, career employees of the EPA, made a number of points about what the authors call the “Acid Rain Myth.” As the authors explain, those who champion the use of cap-and-trade to address global warming ignore the crucial distinctions between the issues in 1990 with acid rain and the issues today with climate change. The following highlights some of Williams and Zabel’s points, which demonstrate that the experiences of the acid rain program are not comparable to a cap-and-trade program for greenhouse gas emissions:
- Most importantly, the success of the Acid Rain program did not depend on replacing the vast majority of our existing energy infrastructure with new infrastructure in a relatively short time. Nor did it depend on spurring major innovation. Rather, the Acid Rain program was successful as a mechanism to guide existing facilities to undertake a fuel switch to a readily available substitute, the low sulfur coal in Wyoming’s Powder River Basin, or to add relatively inexpensive and readily available technology to generating units to reduce SO2 and NOx.
- The goal of the Acid Rain program was to reduce SO2 and NOx emissions, while keeping the cost of energy from coal low. To be effective, climate change legislation must do the opposite; it must increase the relative price of energy from coal and other fossil fuels to create the appropriate incentives for both conservation and the scale-up of wind and solar power, given their true costs. Those costs are hidden due to massive subsidies and no allocation to them of the back-up costs needed for reliability.
- The success of the program was aided by the low, competitive price of low-sulfur coal. While low-cost natural gas has spurred a reduction in U.S. generating emissions, natural gas still emits CO2 emissions.
- According to Professor Don Munton, author of ‘Dispelling the Myths of the Acid Rain Story’ the impact of the program has been overstated: The potential for a massive switch to low sulfur coal was no secret. Such coal was cheap and available, and it became cheaper and more available throughout the 1980s. Indeed, low-sulfur coal became very competitive with high-sulfur coal supplied well before the Clean Air Act became law.
Despite these points, the European Union and certain parts of the United States have instituted regional cap and trade programs. The EU Emissions Trading System was launched in 2005 as part of its “net zero carbon by 2050” program that eventually raised energy prices dramatically, putting more residents into energy poverty and causing industry to flee to areas where they could remain competitive. The first phase covered emissions from power plants and industry such as steel plants, oil refineries, and cement factories in the then-25 EU countries. The system is currently in its fourth phase, covering around 45% of the EU’s greenhouse gas emissions. The EU is expected to launch a new system in 2027 to cover additional sectors like buildings and road transport that are responsible for 40% of its greenhouse gas emissions, with credits trading separately within each system. While the EU has reduced its CO2 emissions from 2005 levels, those reductions represent only about 20% of the increase in CO2 emissions that China has incurred in that time, raising the issue of whether the increased prices and energy poverty to EU residents are worth the reduction if all parties do not participate.
In the United States, the Northeast States launched the Regional Greenhouse Gas Initiative in 2005, requiring fossil fuel generators to hold allowances equal to their CO2 emissions. The states participating are Connecticut, Delaware, Maine, Maryland, Massachusetts, New Hampshire, New Jersey, New York, Pennsylvania, Rhode Island, and Vermont. Of the 11 states, 10 have residential electricity prices that range from 10% to 100% higher than the national average price. California also has a cap-and-trade program covering 85% of its emissions. It has the third highest residential electricity prices in the country, 90% higher than the average national price.
Conclusion
Coal remains an economically vital component of the U.S. and world energy markets. U.S. coal-fired units utilize the best technology to control emissions from the major criteria pollutants. The aspersion that coal is the “dirtiest fossil fuel” masks this reality. If the Trump administration pursues measures increasing the role of coal in America’s energy future, the technologies exist to ensure that it can be done cleanly and efficiently.
The U.S. success story for controlling criteria pollutants is a model for the developing world. The mechanisms available to reduce criteria pollutants allow for energy generation with less pollution. But this success should not be extrapolated to the regulation and reduction of carbon dioxide. None of the conditions existing at the time of the apparent success of the SO2 and NOx reduction program apply to carbon dioxide reduction. Where cap and trade has been applied to reduce CO2 emissions here and in the European Union, electricity prices have increased sharply and industry is struggling to be competitive with areas that do not have such carbon policies.
