The Regional Greenhouse Gas Initiative (RGGI), a cap-and-trade program between nine northeastern and mid-Atlantic states, was recently extended. The states (Maryland, Connecticut, Delaware, Maine, Massachusetts, New Hampshire, New York, Rhode Island and Vermont[1]) have agreed to cut carbon dioxide emissions from power plants by 30 percent from 2020 levels by 2030.[i] According to the initiative, which was originally adopted on January 1, 2009, the revenue that the states obtain from the cap-and-trade program is used to improve energy efficiency, modernize the electric grid and purchase more wind and solar power. However, a recent study funded by the Cato Institute finds that 1) there were no added emissions reductions or associated health benefits from the program; 2) the RGGI revenue spending had minimal impact; and 3) the RGGI allowance costs increased already high regional electricity prices.
RGGI Program
RGGI is a cap-and-trade program that establishes a regional cap on the amount of carbon dioxide that power plants can emit by issuing a limited number of tradable allowances. Each allowance represents an authorization for a power plant to emit one short ton of carbon dioxide. The states distribute over 90 percent of the allowances through quarterly auctions. These allowance auctions generate revenues.
RGGI compliance obligations apply to fossil-fuel power plants 25 megawatts and larger located within the 9 states. As of 2016, there were 163 sources meeting this threshold. Under RGGI, sources are required to own carbon dioxide allowances equal to their carbon dioxide emissions over a three-year control period. The first three-year control period took effect on January 1, 2009, and extended through December 31, 2011. The second three-year control period took effect on January 1, 2012, and extended through December 31, 2014. The third three-year period took effect on January 1, 2015, and extends through December 31, 2017.[ii]
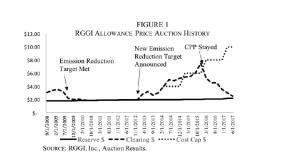
Although the RGGI is referred to as a cap-and-trade program, its effect is the same as a direct tax or fee on carbon dioxide emissions because RGGI allowance costs are passed on from electric generators to consumers. At the most recent RGGI auction that was held on September 6, 2017, allowances cleared at $4.35 per ton and revenues collected totaled $62.5 million.[iii] Allowance prices have ranged from about $2.00 per ton to $7.50 per ton. (See graph below.)
Source: https://object.cato.org/sites/cato.org/files/pubs/pdf/working-paper-45_1.pdf
Cato Institute Study
To determine the impact that the RGGI has on carbon dioxide emissions reductions, the author compared the RGGI states’ emissions reductions and renewable capacity to that of non-RGGI states. The five non-RGGI states selected (Illinois, Oregon, Ohio, Pennsylvania, and Texas) have all deregulated their generating supply sectors as have the RGGI states. The five non-RGGI states also have renewable portfolio standards (RPS), requiring a certain amount of renewable generation by specified dates. RPS programs increase the price of electricity. For example, Delaware’s electricity prices increased 9 percent as a result of its RPS, which can be seen on Delmarva Power’s electric bills. Similarly, Maryland’s electric bills increased 14 percent for the same reason.[iv]
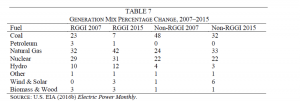
The non-RGGI states added more wind and solar power to their generation mix than the RGGI states. The non-RGGI states added 5.5 percentage points of renewable energy to their generation mix compared to 2.3 percentage points for the RGGI states. Removing the large wind farms in Texas from the calculation, still shows a greater wind and solar generation increase for the non-RGGI states than the RGGI states—3.4 percentage points compared to 2.3 percentage points. In both the RGGI states and the non-RGGI states the share of coal-fired generation decreased by 16 percentage points and the share of natural gas generation increased by about 10 percentage points. (See the table below.)
Source: https://object.cato.org/sites/cato.org/files/pubs/pdf/working-paper-45_1.pdf
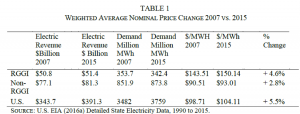
Despite the greater share of wind and solar power, the non-RGGI states had smaller electricity price increases than the RGGI states. The weighted average of total electric revenue for the multi-state groups is given in the table below along with the regional demand. Prices in the RGGI states were 64 percent higher than the non-RGGI states in 2015 and 54 percent higher in 2007.
Source: https://object.cato.org/sites/cato.org/files/pubs/pdf/working-paper-45_1.pdf
RGGI allowance costs added to already high regional electric bills in the RGGI states. For example, according to the study, RGGI allowances added $11 million a year to Delaware’s electric bills.
The impact of the higher electricity prices in the RGGI states resulted in a 13-percent drop in goods production and a 35-percent drop in the production of energy intensive goods. The non-RGGI states increased goods production by 15 percent and only lost 4 percent of energy intensive manufacturing.
Between 2007 and 2015, carbon dioxide emissions were reduced by almost 40 percent from the power sector in the RGGI states. In the non-RGGI states and in the entire country, carbon dioxide emissions from the generating sector were reduced by about 20 percent. But, the magnitude of the carbon dioxide emissions reduction in the non-RGGI states was over twice that of the RGGI states and the magnitude of the reductions nationwide was 9 times that of the RGGI states. (See the table below.)
Source: https://object.cato.org/sites/cato.org/files/pubs/pdf/working-paper-45_1.pdf
Throughout the country, carbon dioxide emissions have declined primarily due to the greater use of natural gas in the generating sector than coal. Natural gas has about half the carbon content that coal has. Its abundance and low cost due to the use of hydraulic fracturing and directional drilling in shale gas formations has resulted in the change in generating mix noted above. As a result, states without a cap and trade program saw major reductions in carbon dioxide emissions. Also affecting the lower carbon dioxide emissions was relatively flat electricity demand, the addition of solar and wind generation due primarily to state RPSs and federal and state subsidies lowering their cost and regulations that required coal capacity to be retired or emissions equipment to be added.
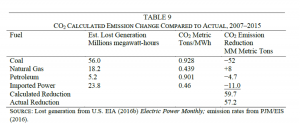
The following table shows the change in carbon dioxide emissions in the RGGI states due to the change in generating mix and including imported power. The calculated change in carbon dioxide emissions reductions is 59.7 million metric tons, which is slightly more than the actual of 57.2 million metric tons.
Source: https://object.cato.org/sites/cato.org/files/pubs/pdf/working-paper-45_1.pdf
Conclusion
The Regional Greenhouse Gas Initiative is purported to reduce carbon dioxide emissions from power plants in the nine states that are members. However, the Cato Institute’s study shows that the reduction in these states is consistent with the reduction in other states that are not members of the initiative. The reduction stems mainly from the substitution of natural gas for coal in the generating sector created by low natural gas prices, but also due to regulations that resulted in the retirement of coal-fired capacity, relatively flat electric demand and the addition of solar and wind capacity resulting from state RPSs and lucrative subsidies for renewable power.
[1] New Jersey dropped out of the RGGI in 2011.
[i] RGGI, RGGI States Announce Proposed Program Changes: Additional 30% Emissions Cap Decline by 2030, August 23, 2017, https://www.rggi.org/docs/ProgramReview/2017/08-23-17/Announcement_Proposed_Program_Changes.pdf
[ii] RGGI, Program Overview, https://www.rggi.org/design/overview
[iii] RGGI, CO2 allowances sold for $4.35 in 37th RGGI auction, September 8, 2017, https://www.rggi.org/docs/Auctions/37/PR090817_Auction37.pdf
[iv] David. T. Stevenson, A Review of the Regional Greenhouse Gas Initiative, August 10, 2017, https://object.cato.org/sites/cato.org/files/pubs/pdf/working-paper-45_1.pdf


