The Intergovernmental Panel on Climate Change (IPCC) has now released the drafts from all three Working Groups of its Fifth Assessment Report (AR5). As we’ve explained before, the media and political spin put on each new IPCC report drastically exaggerates the scientific support for aggressive government interventions in the name of slowing climate change.
In the present post, I walk through some of the basic facts concerning cost/benefit analyses of the supposedly “no brainer” government measures to slow greenhouse gas emissions. Even though these are presented to the public as obviously justified by the underlying peer-reviewed literature, we’ll see that actually the case is quite speculative.
Specifically, I will focus on an extremely misleading post by a leading progressive climate blogger (Joe Romm), to show the nod-nod, wink-wink game that the IPCC plays with its reports. The latest IPCC report gives some numerical estimates that are very misleading, but which allow guys like Romm to bolster public support for aggressive interventions into the energy sector and broader economy. But ironically, I will use the very same IPCC tables to flip Romm’s conclusion on its head.
The lesson here will be the same one we at IER have documented in countless other cases: One doesn’t have to doubt “the science” to show the flaws in the interventionist camp. Rather, we have to dig into what the science actually says to see that the alarmists are spinning a false interpretation of the peer-reviewed results. Just watch how we can walk through Romm’s reporting of the IPCC results, in order to reach the opposite conclusion from what he wants.
The Economic Costs of Government Restrictions on Emissions
Despite the occasional claims that government interventions will provide a “win-win” solution—where not only will we slow climate change, but we’ll also create “green jobs” and otherwise stimulate the conventional economy—in reality most economists acknowledge that a carbon tax, cap-and-trade scheme, or other interventions will carry a stiff economic cost. (Even Paul Krugman says it makes him “cringe” when his allies claim that the switch to “green energy” will be painless.) By forcing businesses and households to rearrange their activities in light of a new constraint (not emitting as much carbon dioxide), these government policies make humanity poorer than it otherwise would be, if we just consider conventional metrics such as job creation, income per capita, GDP growth, and so on.
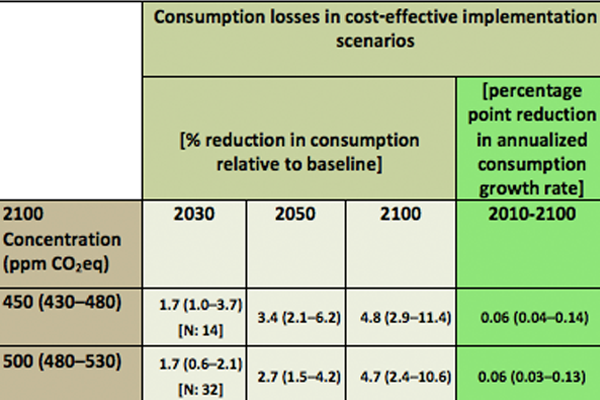
So how exactly large are these genuine economic costs? Well, back in April one of the most popular of the progressive climate bloggers, Joe Romm, gleefully told his readers that the latest IPCC report showed that it would be “super cheap” to take the steps necessary to avoid a climate catastrophe. Here’s the table he produced, which came directly from the Working Group III report from the latest IPCC AR5. (Specifically, Romm grabbed a portion of Table SPM.2 which can be found on page 16 here, though in the interim the IPCC has slightly changed the appearance of the table.)
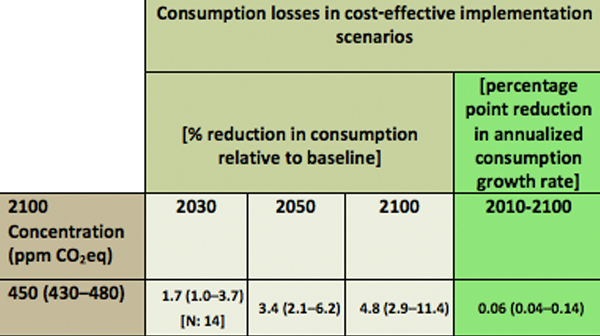
Global mitigation costs for stabilization at a level “likely” to stay below 2°C (3.6°F). Cost estimates shown in this table do not consider the benefits of reduced climate change as well as co-benefits of mitigation. The green columns show the consumption loss in the years 2030, 2050, and 2100 relative to a baseline development without climate policy. The light green column shows that the annualized consumption growth reduction over the century is 0.06%. Source: IPCC 2014.
SOURCE: Joe Romm, ThinkProgress blog post, April 13, 2014.
To make sure the reader doesn’t get lost, let me clarify what Romm is doing: Earlier in the IPCC report (see Table SPM.1 on page 12 here) the IPCC laid out various possible targets for atmospheric concentrations of greenhouse gases (measured in the equivalent of parts-per-million [ppm] of CO2) in the year 2100. The most aggressive goal for which there had been adequate analysis was to stabilize concentrations at 450 ppm. (Standard estimates currently put the concentration of CO2 at a little over 400 ppm.) The IPCC report then said that if humanity could limit the rise in concentrations to 450 ppm, it was “likely” (their term) that the total warming in the 21st century, relative to preindustrial times, would be limited to 2 degrees Celsius.
This is what Romm wants. He is one of the loudest advocates for aggressive government action to fight climate change. So naturally he zooms in on the most aggressive target studied by the IPCC. Now, in order to reassure his readers that such an aggressive goal would be “super cheap,” Romm takes a snapshot of a different table from the same IPCC summary report—this is what we’ve shown above.
In this new table, Romm is simply repeating the IPCC analysis of the drop in consumption flowing from government policies that limit atmospheric concentrations to 450 ppm by the year 2100. As the table indicates, such a strategy will mean that consumption through the year 2100 will merely have a best-guess of 0.06 percentage points subtracted from its baseline annual growth rate. (It’s the “0.06” in the bottom right cell in Romm’s table, above.) The reason this seems like small potatoes is that it implies merely a slight reduction in the rate at which consumption grows. For example, if the growth rate of consumption would normally be 2.00% per year, Romm is happily reporting that his draconian restrictions on emissions would merely reduce the growth rate of consumption to 1.94% per year. See, everybody? Romm’s climate policies are “super cheap.”
Yet hold on a second. Even taking Romm (and the IPCC) at face value, there are several problems with this type of argument. After we walk through them, we’ll expand our analysis to look at the benefits of these mitigation policies, and see how they compare to the costs.
Problems With Romm (and IPCC) Reporting of the “Super Cheap” Cost of Anti-Carbon Policies
First of all, the numbers in the IPCC table (a portion of which Romm reproduces) refer to an idealized, theoretically optimal, immediate imposition of a global carbon tax. Any actual mitigation policies deployed in the real world will hurt the conventional economy more than these numbers suggest, in order to achieve a desired climate objective (in Romm’s case, limiting temperature increases to 2 degrees Celsius).
To give you an idea of just how important these adjustments could be, consider this: In the 2008 update to his “DICE” model, leading climate economist William Nordhaus reported that if only half of the world’s emitters participate in a carbon tax, that the economic cost of achieving a desired climate objective will increase by 250 percent. (See page 213 here.) So the “super cheap” climate policies favored by Romm become drastically more expensive if major countries such as China and India decide to focus on their economic growth in the present, rather than keeping the earth a degree cooler in the year 2100.
Second, even if we take Romm’s table at face value, the focus on the “0.06%” smaller growth rate in annual consumption is extremely misleading, because it happens over the course of many decades. Look again at the other numbers in Romm’s table (which, to repeat, he is simply pasting from the IPCC): The best-guess of the cumulative reduction in consumption by the year 2050 is 3.4%, while by the year 2100 it rises to 4.8%. (These are the middle numbers in the bottom row of Romm’s table.) In other words, the IPCC is reporting that if governments around the world implement a theoretically ideal carbon tax (designed to limit atmospheric concentrations to 450 ppm), the best guess is that consumption in the year 2050 alone will be 3.4% lower than in the no-intervention baseline, and that consumption in the year 2100 alone will be 4.8% lower.
Third, note that these cumulative figures are merely the best guess. The range of cumulative consumption losses is very wide. This information is also in Romm’s table; it is contained in the parenthetical ranges in each cell. Specifically, if you look again at Romm’s table in the cell under the year “2100,” it shows that by the year 2100, his preferred mitigation policies could reduce consumption in that year alone by up to 11.4%. How likely is such a huge loss in consumption? If you go to the IPCC’s original discussion on page 16 here, you’ll see that the confidence interval for this range is the 16th through 84th percentile.
In other words, the very same IPCC table that Romm is celebrating, also tells us that the policies Romm endorses have a 16% probability of making global consumption in the year 2100 alone at least 11.4% lower than it would be in the no-intervention baseline. (We are here focusing on conventional economic growth, not taking into account climate change. The point is to understand the conventional economic cost of Romm’s preferred measures, so we have a basis for analysing their potential climatic benefits.)
Already this is getting much more expensive than Romm led us to believe. Would the casual reader of his post have had any idea that “the consensus science” was reporting Romm’s desired measures had a 16% chance of reducing the entire Earth’s consumption by at least 11.4% in the year 2100 alone? Hardly—Romm instead tells us these policies are “super cheap.”
Before moving on, let me make an important point: Romm is a pretty technically savvy guy, and knows how to actually read these IPCC tables. From the table he pasted in his blog post, Romm focused on a single number: The “0.06” in the bottom-right green cell. Yet what I’ve done in my “revisionism” here is simply to explain to readers what those other numbers in the IPCC table mean. The problem is, most people don’t have the time to figure this stuff out, and so without Romm being so kind as to inform them, they have no idea what, say, the “(2.9 – 11.4)” means in the tan cell at the bottom of his table. You would need a “denier” like me to come along and tell you that this is how the IPCC tells us that there is a 16% probability that consumption in the year 2100 will be at least 11.4% lower because of Romm’s preferred policies.
Romm Paints Himself Into a Rhetorical Corner
But wait, it gets worse for Romm. You see, he doesn’t simply want to build public support for aggressive government interventions to stem emissions for some point down the road. No, Romm wants the government to intervene right now.
This leads to trouble for Romm. Think about it: On the one hand, he wants to cherry pick from the IPCC report in order to show that the cost of the most aggressive limits on emissions will be “super cheap.” But on the other hand, he wants to convince his readers that delay in the implementation of these aggressive limits will be super expensive. Romm tries to thread this rhetorical needle by titling his blog post, “Climate Panel Stunner: Avoiding Climate Catastrophe Is Super Cheap — But Only If We Act Now.”
But this won’t really work. If it’s really true—as Romm assures us it is—that it’s “super cheap” to implement his desired policies right now in 2014, then the very same IPCC table shows us it won’t be too expensive if we delay all action until 2030. Oops, sorry Joe. The way Romm deals with this awkward fact is to simply omit that portion of the table.
Below I’ve reproduced a bigger picture of the table (showing all of the columns but not all of the rows) coming from page 16 of the Working Group III Summary for Policymakers that Romm grabbed for his own blog post. (If you click the link, note that the table now has different shading from when Romm and I took our snapshots of it.)
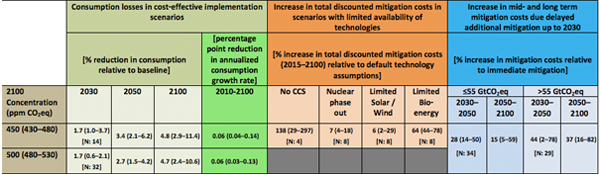
As you can see, for his blog post Romm merely grabbed the top left portion of this IPCC table. But I want to direct your attention to the blue columns on the far right. These show the percentage increases in the total (undiscounted) mitigation costs for various atmospheric concentrations, for the years 2030-2050 and also for 2050-2100, for two different scenarios of total emissions (either below 55 gigatons of CO2-equivalent, or above) in the year 2030.
What do these blue cells tell us? If we are talking about the concentration targets Romm desires, then by delaying government intervention through the year 2030, even in a high-emission baseline scenario the best guess of the cost of achieving Romm’s desired outcome rises by 44% in the years 2030-2050 and 37% in the years 2050-2100.
Now we see the rhetorical corner into which Romm has painted himself. If we are to believe him that the cost of achieving his desired goals is “super cheap” if governments start immediately, then the IPCC itself is telling us the cost of achieving these same goals is only going to be about 40% higher through the end of the century, if we first wait and collect more data through the year 2030, before pulling the trigger. Does something that starts out at “super cheap” suddenly become “too costly to imagine” by going up 40%?
Let me put it this way: Romm tried to show his readers how “super cheap” his goals would be to achieve, by expressing their cost in the form of a 0.06% reduction in annual consumption growth. Okay, so if governments around the world waited until 2030 before taking action, then the drop in annual consumption growth would be more like 0.08%. Does that sound like a crime against humanity? If that had been the first number the IPCC reported—referring to the cost of immediate action—would Romm have thrown up his hands and admitted it was too expensive to contemplate?
Conclusion
Romm and his interventionist allies can’t have it both ways. The IPCC is reporting that whatever the economic costs of immediate stabilization policies are, they will increase by 28 to 44 percent (as best guesses) if governments around the world wait until 2030 to begin implementing them. So which is it, Romm & Company? If you are telling us that waiting until 2030 would mean humanity is screwed, then that means we’re screwed right now: We might only make ourselves 28 percent better off by starting now, rather than in 2030—what’s 0.72 times “totally screwed”?
On the other hand, if it’s true as Romm says that taking immediate action will be “super cheap,” then delaying until 2030 will only raise the price tag of those “super cheap” climate fixes by 28 to 44 percent, and so our best guess is that Romm’s climate fixes would be—what?—“still pretty darn cheap” or maybe “hey, not too shabby” at that time.
To repeat, this is the rhetorical corner into which the alarmists have painted themselves. They want to scare everybody into thinking that governments need to take immediate and aggressive action to avoid the literal disruption of human life as we know it. On the other hand, they want to assure us that their draconian policy proposals—if implemented next Tuesday—will only cause a slight hiccup in our present standard of living. Those two pictures do not fit together, and that’s why Romm & Company have to cherry-pick from the IPCC’s reports on the published literature.
Josiah Neeley gave helpful comments on early drafts of this post.