
Energy is a crucial ingredient in every aspect of our lives, whether at home, school, or work. Fortunately, over the long-term, energy has become more affordable for Americans, measured in various ways. This is not a surprise, as human ingenuity and (relatively) free markets allow entrepreneurs to multiply the gifts of nature, even for so-called “depletable” resources.
However, in recent years energy has become less affordable. This too is not surprising, as the federal government has impeded the ability of firms to develop domestic energy resources, and as the Federal Reserve has weakened the dollar. If policymakers wish to raise U.S. (and world) living standards, they should move back in the direction of stable monetary policy and unfettered capitalism. The natural forces of innovation in a market economy will lead to more abundant supplies, in the economically relevant sense.
Long-Term Trend: Energy Becomes More Affordable
Viewed over the course of decades, energy has become much more affordable for Americans. In their book It’s Getting Better All the Time, Stephen Moore and Julian Simon document various measures of this fact. For example, they cite William Nordhaus’ calculation that the price of lighting has fallen significantly since the electrification of the nation began in the early 1900s. Originally, the price of 10,000 lumens was about $4, whereas by the end of the 20th century it had fallen some 99.5 percent, down to less than a penny. For another example related to lighting: In 1938, the average fluorescent light bulb lasted 1,500 hours, whereas by 2000 it lasted 100,000 hours.
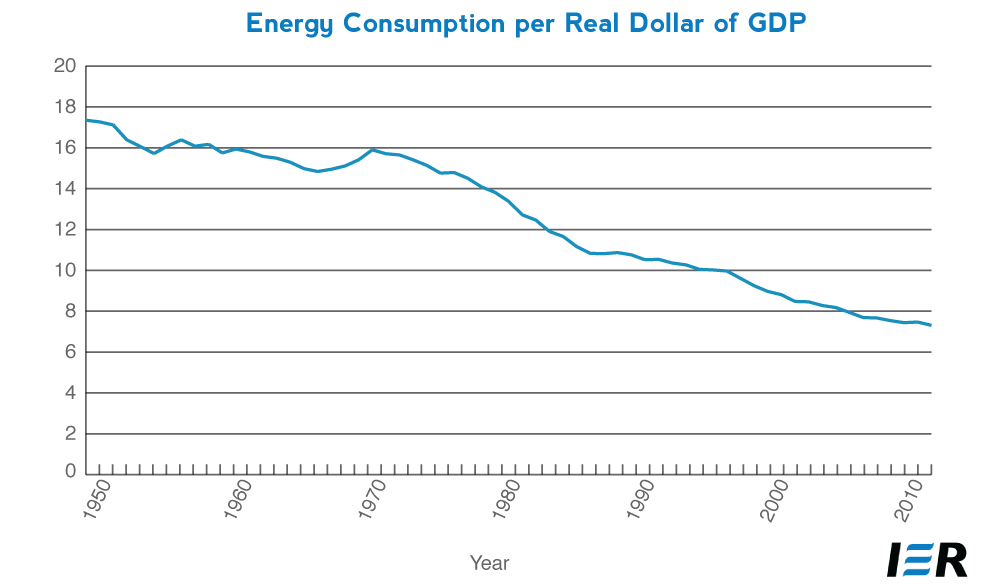
Over long stretches of time, the U.S. economy has become steadily more efficient in its use of energy, as measured by physical units of energy expended per dollar of real output. From 1949 to 2011, for example, the amount of gross output (in inflation-adjusted dollars) per unit of energy (in BTUs) almost doubled.[1]
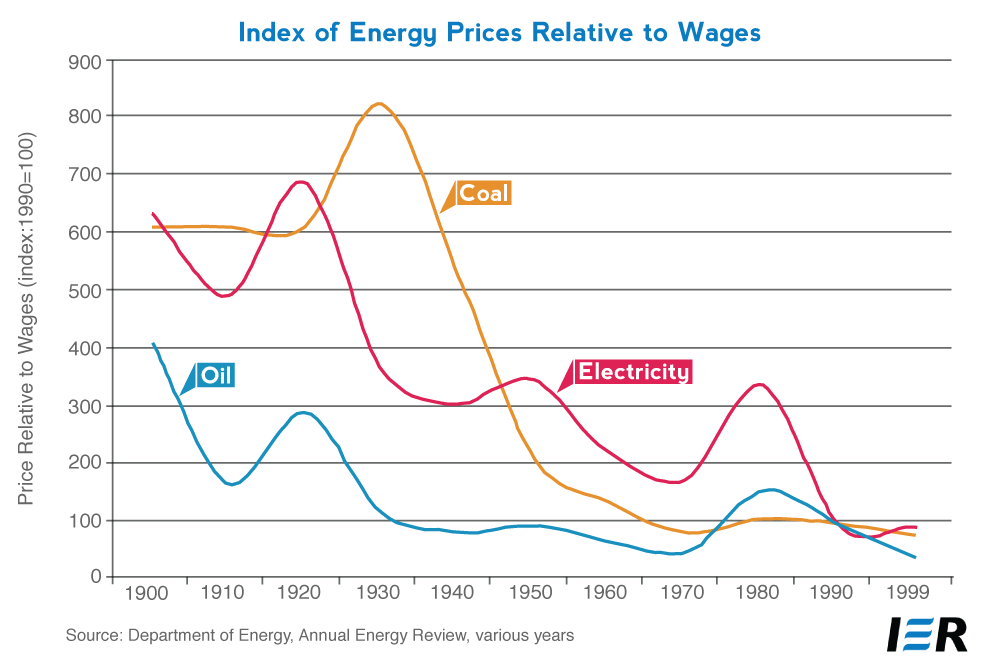
Another way of seeing the long-term trend is to look at energy prices compared to average wage rates. This indirectly shows how much time a worker needs to spend, in order to make enough to buy a given amount of energy. The chart below shows the astounding improvement:
What is truly shocking—at least to those who don’t appreciate the wonders of entrepreneurship in a market economy—is that the economically relevant “supply” of so-called depletable resources has risen over the decades, too.
To take just one example: We can define how many “years worth of oil” the United States has, by taking the known oil reserves and dividing by current rates of oil consumption. Since there is only a fixed amount of oil on planet Earth, and since the rate of oil consumption has steadily risen since the Industrial Revolution, one would initially suppose that the “number of years left” would constantly shrink.
And yet, the opposite is true. In fact, the window of oil availability generally improved over the 20th century. At the end of 1944, “proved reserves” of crude oil were 51 billion barrels worldwide. By 2003, the number had grown to 1.27 trillion barrels of proved reserves. Given the annual rates of consumption in the two years, the world went from a proven supply of under 25 years’ worth of oil in 1944 to a supply of about 44 years in 2003.[2]
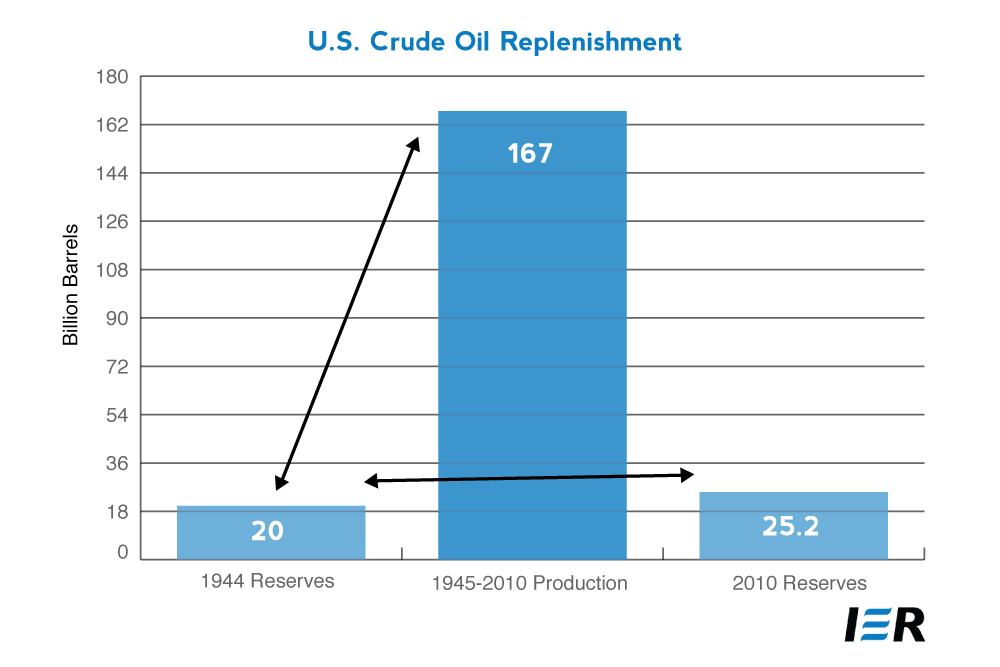
For a more modern illustration, consider: In 1944, the U.S. had oil reserves of 20 billion barrels. And yet, from 1949 through 2010, the U.S. produced 167 billion barrels of oil from domestic sources. That means the U.S. produced more than 700 percent of its reserves, starting from 1949. Obviously there is something fishy going on here.
 The explanation for this counterintuitive result is that, even though in a physical sense oil is a finite resource, in an economically relevant sense the amount of oil available for human use can expand, when prices rise. This is because the rising price gives a signal for entrepreneurs to go find more oil. As the above statistic illustrates, the process can work so well that humans actually become more energy-abundant over time, even with a depletable resource.
The energy doomsayers—who are constantly urging forced conservation and other restrictions on living standards—miss this mechanism. They are analogous to a child who checks the pantry for three days in a row, then announces to his parents that they have to start making sandwiches with only one slice of bread. The parents would explain, with a smile, that before “running out of bread” they would simply go to the store and buy more. It is similar with “oil reserves” and other such categories.
Indeed, currently there is enough natural gas in North America to power the U.S. (at current rates of consumption) for 175 years. There is enough “technically recoverable” coal to last for 500 years.
Clearly, the United States does not suffer from a scarcity of natural energy resources.
Energy Less Affordable in the Short Term
Unfortunately, although the long-term view is optimistic, over the last few years there have been disturbing trends in energy affordability, with the notable exception of the natural gas boom—which obviously is occurring despite government efforts to stymie it.
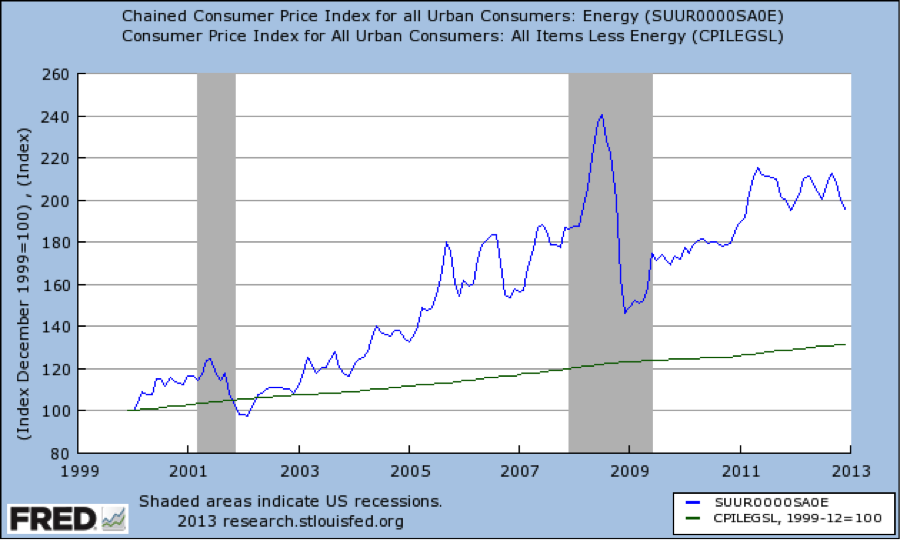
The above chart shows that since 2003, there has been a steadily increasing gap between energy prices, relative to other consumer prices. In other words, energy has gotten more expensive than the rest of the items measured in the Consumer Price Index (CPI).
There are of course numerous factors explaining relative price movements, but what we can say with confidence is that government restrictions on the development of domestic energy resources, makes energy more expensive than it would otherwise be.
We can also point to monetary policy as being instrumental in driving at least a portion of the run-up in prices. Many economists believe that in response to perceived “loose” Fed policies, the dollar falls and speculators rush to inflation havens, such as gold and silver but also commodities in general, including oil. Look at the connection between crude oil prices and the various rounds of “quantitative easing” by the Federal Reserve:
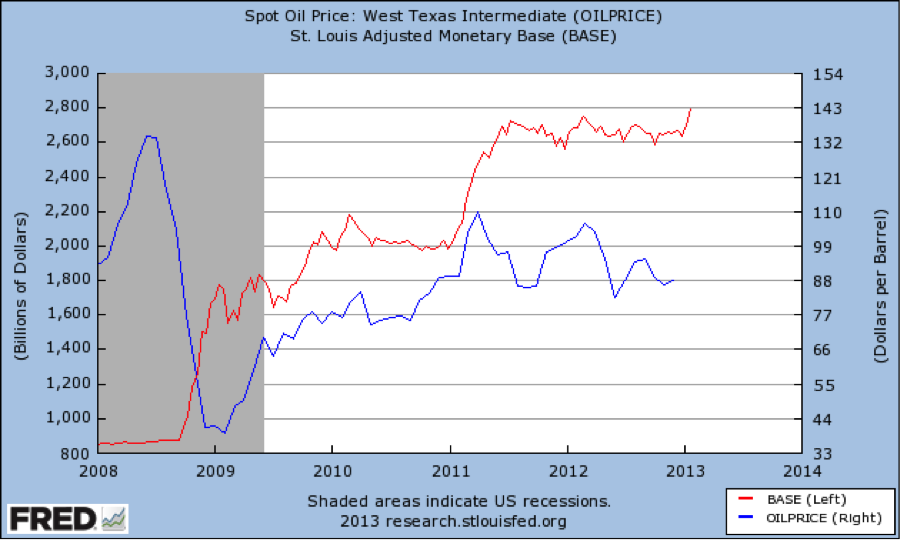
The fit is not perfect, of course—nothing ever is in macroeconomics—but since early 2009, the movements in oil prices closely follow the movements in the Fed’s balance sheet (approximated here by the “monetary base”), particularly during the two years from early 2009 to early 2011.
In fairness, one could defend Ben Bernanke by saying that with every round of “quantitative easing,” investors thought the world economy was on the road to future growth, and hence bid up the price of oil. Yet a cynic could equally well argue that the world economy is hardly in a robust recovery, despite literally unprecedented monetary inflation from the Fed and other central banks. A more plausible explanation of the chart above is that commodity prices are being bid up by the flood of liquidity crashing into an economy with very weak fundamentals because of misguided government policies.
Conclusion
Over the long term, energy in various forms has become ever more affordable. This is the natural outgrowth of (relatively) free-market capitalism. Even though certain resources are fixed in a physical sense, their “economic” quantity grows over time with innovation in uses and new discoveries.
However, during a shorter time frame, energy has become relatively more expensive for Americans. This can be partially attributed to government policies that restrict domestic development, and to Fed policies that encourage speculators to flee to inflation hedges such as commodities.
[1] Energy Information Administration, Annual Energy Review, Table 1.5, http://www.eia.gov/totalenergy/data/annual/pdf/sec1_13.pdf.
[2] See Robert Bradley and Richard Fulmer, Energy: The Master Resource, page 9 of Chapter 4, “Will We Run Out of Energy?”
