
The rapid (and largely unexpected) collapse in oil prices over the last two years no doubt has many causes, because oil is a commodity traded in the world market. The conventional factors affecting supply and demand are at play in the recent price dynamics, including the enormous increases in production on non-federal lands in the US. However, the data reveal a large role for the Federal Reserve’s monetary policy, as well. Just as I testified before Congress in 2011 arguing that expansionary Fed policy was contributing to high oil prices, we can now see that the Fed’s tightening is contributing to low oil prices.
In this post, I will appeal to several charts to make the connection. But I should be clear that the Institute for Energy Research does not have an institutional position on Federal Reserve policy as such. I am merely showing that the wild ups and downs in oil prices are at least partially due to the unprecedented actions of the Federal Reserve.
The Connection Between the Fed and Oil Prices
Economist Lars Christensen recently tweeted the following chart:
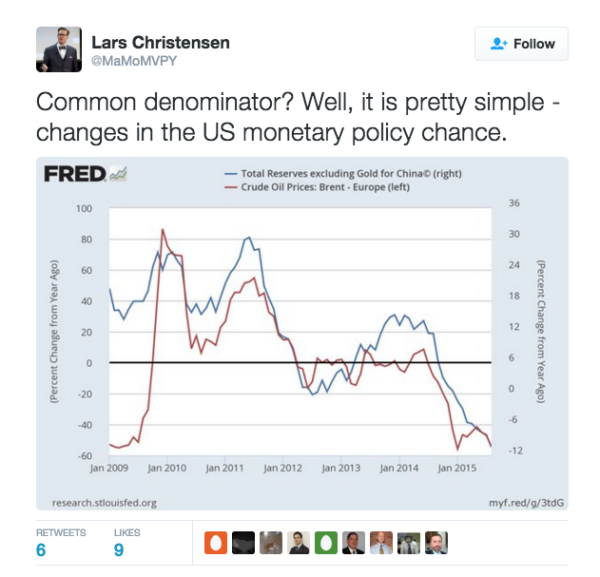
(I believe he has a typo in his commentary, and meant to write “US monetary policy stance.”)
In the chart above, Christensen shows that since mid-2009, the year/year percentage changes in the amount of reserves in the US financial system match up pretty closely with the change in Brent crude oil prices, if we adjust the axes.
To get a different take on the same idea, consider the chart below that I created at the St. Louis Fed’s website. It plots the “monetary base”—which is a measure of total currency plus commercial bank deposits with the Fed—against the price of oil.
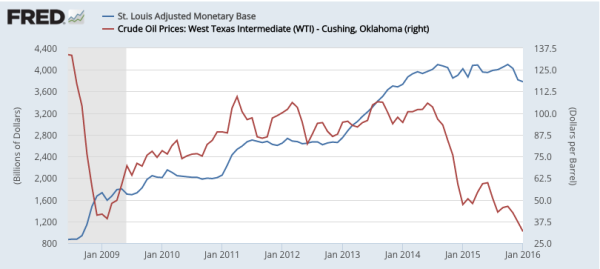
As the chart indicates, during the three rounds of “quantitative easing,” the Fed expanded the monetary base (blue line) while the price of oil (red line) rebounded from the $30s back up to more than $100 per barrel. Yet once the “taper” had finally wrapped up, so that the Fed was no longer pumping in more money by October 2014, the price of oil was in free-fall. Thus, it seems that the Fed’s easy money policies pushed up the price of oil, while removing the monetary “stimulus” let oil fall.
To shed more light on how the Fed and oil prices are connected, we can also look at the Fed’s policies and the strength of the US dollar against other currencies. The basic fact here is that oil prices are set in the world market. Therefore, if the US dollar weakens against other currencies, then (other things equal) this will push up oil prices quoted in USD. On the other hand, if the US dollar strengthens against other currencies, then (other things equal) this will push down oil prices quoted in USD.
Armed with this insight, we graph the monetary base and an index of the USD’s strength in the foreign exchange market in the next chart:
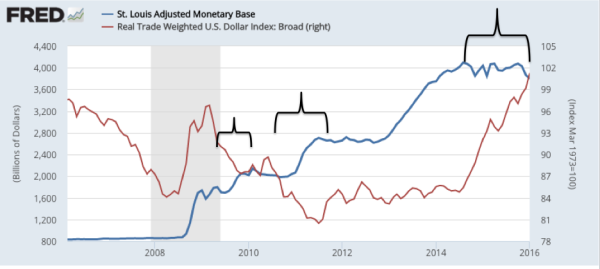
In the chart above, I’ve used the black curly braces to draw attention to key three episodes. In the first, notice that the strength of the dollar (red line) falls sharply as the Fed began its first round of QE (seen as the blue line rises in 2009).
Underneath the middle black curly brace, we see a similar pattern: The dollar index (red line) falls sharply as QE 2 kicks in and the monetary base (blue line) jumps up. Notice also that the dollar rebounds as QE 2 ends, with the flat blue line beginning in the end of 2011.
The final black curly brace shows what happened when the Fed ended the taper and closed down the QE 3 expansion, so that the monetary base stayed constant since late 2014. We see that just around this period, the dollar began strengthening significantly, appreciating from about 85 up to 101 on the FRED index—a gain of about 19 percent.
This is pretty straightforward stuff: When the Fed creates a burst of new dollars, the USD tends to weaken against other currencies. On the other hand, when the Fed slams on the brakes and stops making new dollars—especially in an environment where other central banks are inflating—then the USD strengthens against other currencies.
As the chart shows, the dollar rose about 19 percent since late 2014. This fact by itself partly explains when oil prices—quoted in USD—have fallen over that period. It doesn’t explain the whole drop, to be sure, but it is one obvious piece of the puzzle.
Conclusion
Oil is traded on a world market, with billions of people making decisions that cumulatively yield the market price. Even so, the data clearly show that the Fed’s expansionary policy went hand-in-hand with a weakening dollar and rising crude prices, while the Fed’s moves towards neutral and now tightening policy have resulted in a strengthening dollar and crashing crude prices. Analysts should keep these forces in mind when trying to explain what happened, and what the future holds in store.
