
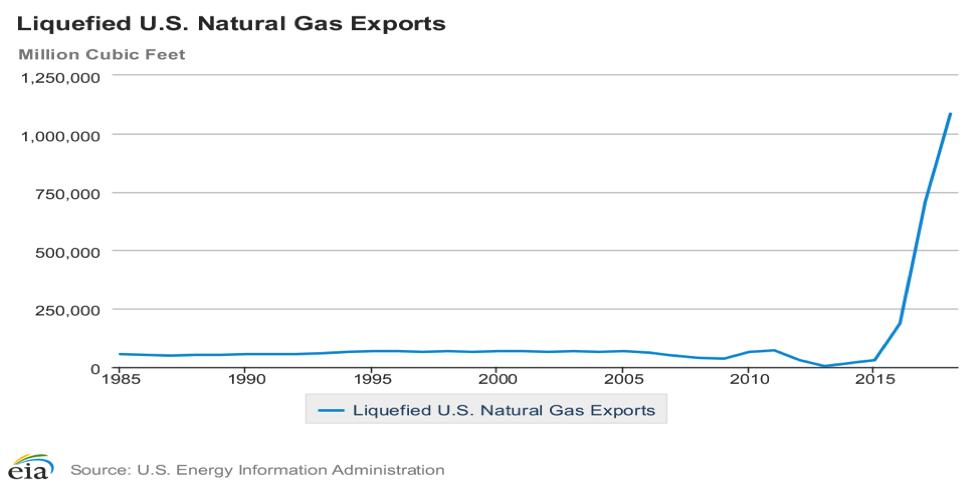
In 2018, over one trillion cubic feet of liquefied natural gas (LNG) was exported from U.S. liquefaction terminals—an increase of almost 500 percent over 2016 levels, when Cheniere Energy opened its first terminal at its Sabine Pass facility in Louisiana. The United States shipped LNG to over 30 countries in 2018 with South Korea, Mexico, Japan, and China receiving the largest shipments. The Energy Information Administration (EIA) expects the United States to become the number 3 LNG exporter in the world this year, behind Australia and Qatar, as more U.S. liquefaction terminals come online. By year-end, U.S. LNG export capacity is expected to reach 8.9 billion cubic feet a day—2.5 times the current 3.6 billion cubic feet of export capacity.
U.S. Liquefaction Terminals
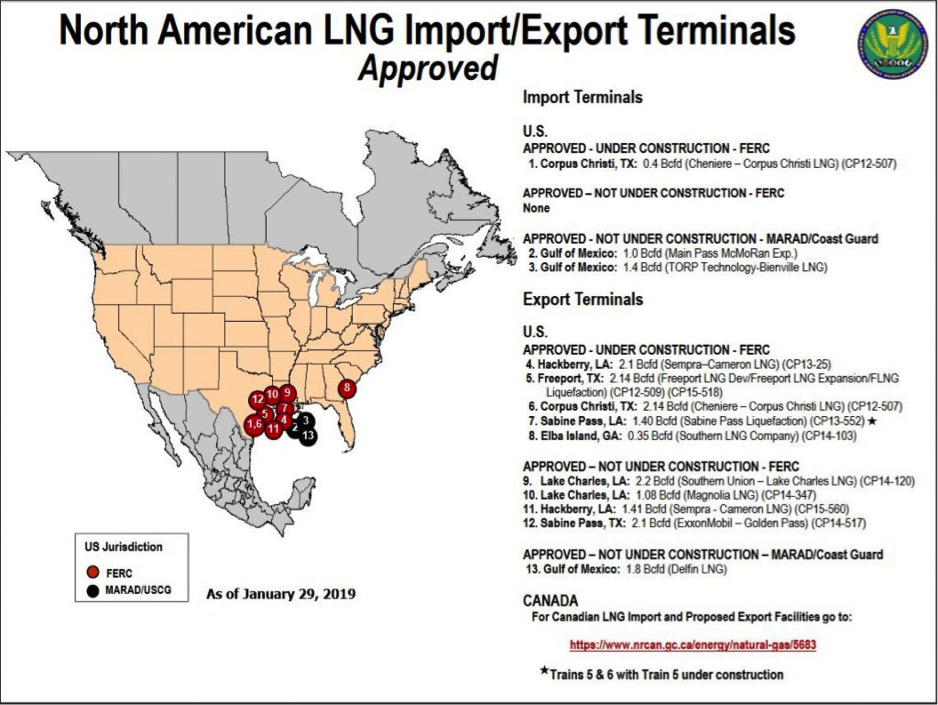
Currently, the United States has 3 commercial terminals operating in Louisiana, Maryland, and Texas. The Sabine Pass facility in Louisiana opened its first train in early 2016 and has 4 trains currently in commercial operation. (An LNG “train” is an independent unit for gas liquefaction. An LNG plant may comprise one or more trains.) Cheniere Energy completed the facility’s fifth train in December 2018 and is expected to have it in commercial operation by September 2019. A sixth train has been approved by both the Department of Energy and the Federal Energy Regulatory Commission, but it is contingent on securing long-term LNG contracts. Each train has a capacity of 0.69 billion cubic feet per day.
The Cove Point facility in Maryland began commercial operation in March of 2018 and has a capacity of 0.76 billion cubic feet per day. It was originally constructed by Dominion Energy as an import terminal but was retooled as an export terminal. Cove Point was the first terminal retooled as the United States moved from expediting LNG import terminals to meet our growing natural gas needs to expediting export terminals to handle the enormous new quantities of natural gas produced from shale basins by horizontal drilling and hydraulic fracturing technology.
Cheniere Energy completed construction on its first train at Corpus Christi, Texas in December 2018. That train is expected to be in commercial operation by June of 2019. Two more trains are under construction. Each train has a capacity of 0.66 billion cubic feet per day.
Also under construction are facilities at Elba Island, Georgia; Hackberry, Louisiana; and Freeport, Texas. Elba Island is a relatively small-scale facility owned by Kinder Morgan with a total capacity of 0.36 billion cubic feet per day when completed this year. It was originally constructed as a regasification plant for imports of LNG and it is being retooled as an export facility. The project will use ten small scale liquefaction units, constructed in two phases. The first phase is expected to be completed in the first quarter of 2019, and the second is expected to be completed in the third quarter of 2019.
Cameron LNG owned by Sempra Energy has three trains currently under construction in Hackberry, Louisiana, which are expected to be completed this year. Each train has a capacity of 0.66 billion cubic feet per day. Freeport LNG has three trains currently under construction, two of which will be completed this year and the third in 2000. Each train has a capacity of 0.71 billion cubic feet per day.
Also approved, but not under construction are two export terminals in Lake Charles, Louisiana. Lake Charles LNG Export Company has plans for a 3 train facility, each train with a capacity of 0.7 billion cubic day, and, Magnolia LNG has approval for a 1.1 billion cubic foot per day facility. Other approved facilities are Delfin LNG, Golden Pass, and Calcasieu Pass with a combined capacity of 5.4 billion cubic feet per day. The latest information on the status of U.S. liquefaction facilities, including expected online dates and capacities, is available in EIA’s database of U.S. LNG export facilities.
Global LNG Demand
Japan is currently the world’s largest importer of LNG, using LNG to supply all of its natural gas needs, including power generation. Japan currently imports three percent of its LNG from the United States. Over a third of Japan’s LNG imports come from Australia, and Malaysia supplies about 12 percent. Japan is reliant on imported resources for over 90 percent of its energy supply. But, Japan’s demand for LNG is expected to lessen somewhat as it brings nuclear capacity back on-line, after a period of non-use due to the accident at Fukushima caused by the tsunami that hit in March 2011.
Other Asian nations – such as China, Vietnam, Thailand, and countries in Southeast Asia – are increasingly becoming dependent on natural gas. China is the world’s main LNG demand growth market, though its demand growth is expected to slow a bit this year as China is increasing its pipeline connectivity, building more storage and import terminals, and increasing domestic natural gas production. In 2018, China’s natural gas imports—including pipeline and LNG imports—increased by almost 32 percent from 2017 to a record 90.39 million tons, making China the world’s biggest importer of natural gas—both pipeline and LNG. China is currently the world’s second-largest LNG importer behind Japan, but it is set to overtake Japan as the top global LNG importer by 2022.
South Korea is the world’s third largest LNG importer after Japan and China. Its LNG demand is typically between 33 million and 37 million metric tons of LNG per year, used mainly for heating, power generation and cooking. South Korea, however, is expected to increase its LNG demand by almost 14 percent this year from 37.6 million metric tons in 2017 to 42.8 million metric tons in 2018.
Thailand’s LNG imports are expected to more than double over the next five years from its current 5 million metric tons per year due to its declining domestic natural gas production, which powers most of its electricity.
Energy-hungry Vietnam, whose electricity demand is increasing at 10 percent per year, has plans to construct its first LNG terminal at the southern port of Thi Vai. Winning bids for the project are expected to be finalized this month and construction could start this year, with operations slated to begin in 2023. The 1 million ton LNG facility will supply multiple power plants to be built concurrently, with their combined output reaching 1,500 megawatts. Nearly 10 LNG terminals are in the planning stages in Vietnam as the country is emerging as a global manufacturing hub.
India’s demand for LNG is set to increase by about 10 percent this year despite import capacity being added at a faster rate because infrastructure constraints are keeping the gas from getting to consumers and hindering growth rates.
Southeast Asia is clearly becoming a major LNG consumer. Global LNG demand increased 8.5 percent to 308 million tons last year—up from 284 million tons in 2017. That number is forecast to hit 450 million tons in 2030. Asia is expected to account for the majority of the 167 million additional tons of LNG expected to be consumed between 2017 and 2030. Of that increase, Southeast Asia is expected to use 44 million tons, just behind India’s 61 million tons and China’s 53 million tons.
Despite Asia being the largest LNG market, Europe is also expected to increase its demand for LNG. Europe has long been considered as the ‘sink’ of the LNG market, absorbing the cargoes that do not get sold on the Asian market. Forecasters, however, expect Europe to become an LNG demand market after 2021, as natural gas production in northwest Europe is set for a decline and as global LNG supply growth is set to likely outstrip Asian demand growth.
Poland opened its LNG facility in 2015. The government plans to expand that facility, which currently has the capacity to import about a quarter of Poland’s yearly needs. Germany is expected to build two LNG regasification terminals in the foreseeable future.
Demand for LNG Tankers
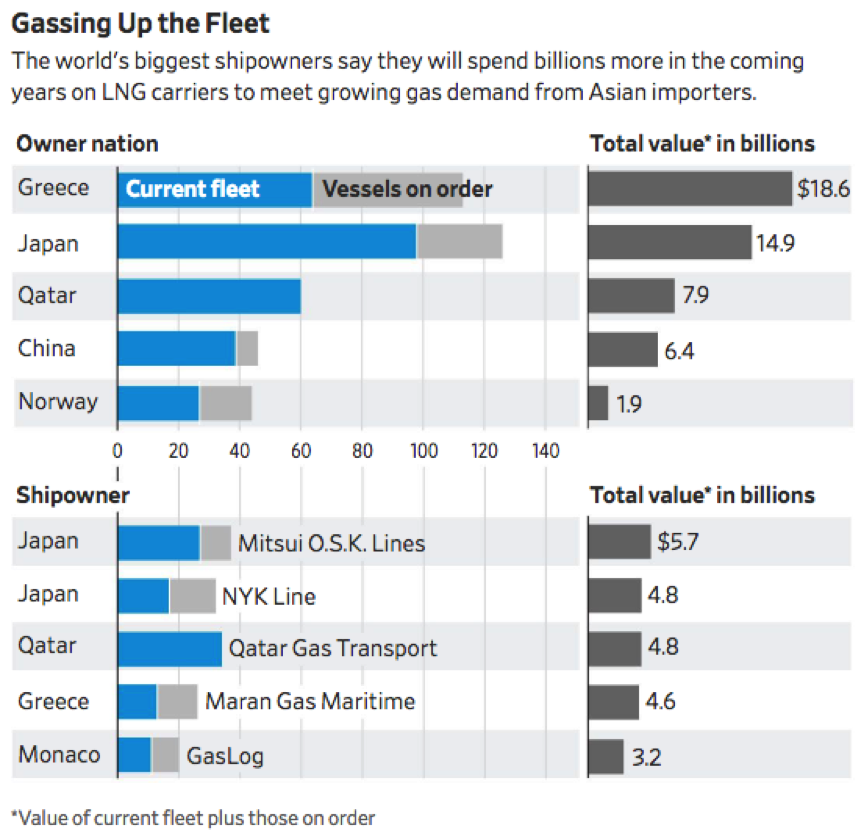
New U.S. LNG projects coming online in the next few years are expected to boost the global fleet of seagoing LNG tankers by as much as a third. Vessels outfitted for liquefied natural gas can cost several times more than other ship types at about $175 million. LNG tankers cost more than oil tankers because of the technology needed to manage natural gas on long voyages. The gas is liquefied onshore by chilling, and, special alloys are needed for the ship’s tanks to keep the temperature at minus 165 degrees Celsius (minus 265 Fahrenheit) so that the cargo does not evaporate.
Growing demand from Japan, China, India and Southeast Asia has helped to triple seaborne gas cargoes since 2000 to 308 million metric tons in 2018. As mentioned above, capacity for almost another 170 million metric tons is expected to be added by 2030 if planned projects for liquefying the gas for transport are completed.
There are about 520 tankers capable of carrying LNG across oceans today and expectations are that the fleet will grow by about 28 percent by 2020—about the same as the growth in production. Ship owners expect demand to run ahead of shipping capacity until at least 2024.
South Korea’s Hyundai Heavy Industries Co. and Daewoo Shipbuilding & Marine Engineering Co., which are completing a merger, will be the biggest beneficiaries, as they control a combined 52 percent of existing orders worth $31.4 billion. Including 101 ships on order worldwide, the global fleet of LNG tankers has a value of nearly $50 billion. (See chart below.)
Conclusion
LNG is clearly a growing market for both suppliers and consumers. The United States will be an increasingly larger player as more terminals get built and Asia will continue to be the largest demand market as its economies grow and energy needs increase. Europe is expected to become a larger player in the LNG market after 2021. Since energy is so essential to everyday life and since the United States has moved from a position of weakness in natural gas to one of strength, opportunities abound for both commercial benefits for the United States and substantial geostrategic benefits as energy plays a larger role in the world’s economy.
