
Operational solar assets are continuing to experience higher than expected rates of degradation, with annual degradation in the field at around 1 percent, according to a Solar Risk Assessment report by kWh Analytics. The report details the risk to solar assets posed by financial modeling, operational performance, and extreme weather. It finds that assumptions made in 2016—that solar modules would degrade by around 0.5 percent annually—is outdated and underestimates annual degradation by as much as 0.5 percent. kWh Analytics places the median annual degradation for residential solar systems as 1.09 percent and non-residential systems at 0.8 percent. The report states that over a 20-year asset life, project degradation could therefore be underestimated by as much as 14 percent.
Financial Modeling and Operational Performance
A number of companies contributed to the report. PV Evolution Labs noted that small differences in raw materials can impact overall system performance by as much as 5 percent. The price of many materials used in making solar panels is unstable due to the effects of the global pandemic, significant expansions in capacity and demand, shipping container shortages, wafer size increases, and policy changes restricting imports from different regions. For example, after dropping below $8 per kilogram during the global pandemic due to oversupply, polysilicon prices have risen sharply since the fourth quarter of 2020 and are expected to stay high through 2021. Meanwhile, regulatory factors and growing demand for dual-glass bifacial modules have caused a glass shortage. Furthermore, the solar industry will require 15 percent—up from 10 percent today—of the global silver supply by 2025, likely impacting prices for that material as well.
An analysis of nearly 2 gigawatts of utility and commercial solar plants in 2020 shows that 80 percent of performance-related plant tickets are caused by inverter outages. The inverter outages result from a continued reliance on the original equipment manufacturer (OEM) warranty services and extreme weather. Additionally, pandemic travel restrictions significantly impacted mean time to repair (MTTR), further impacting project performance and underscoring operation and maintenance challenges.
Many inverter manufacturers are reluctant to offer training and certification to operation and maintenance providers to allow them to independently change out failed subcomponents without voiding the warranty. Relying on the original equipment manufacturer often causes delays in repairs and long outage times due to technician unavailability. These inverter repair delays were exacerbated in 2020 and 2021 with extreme events: the global pandemic and Texas Winter Storm Uri.
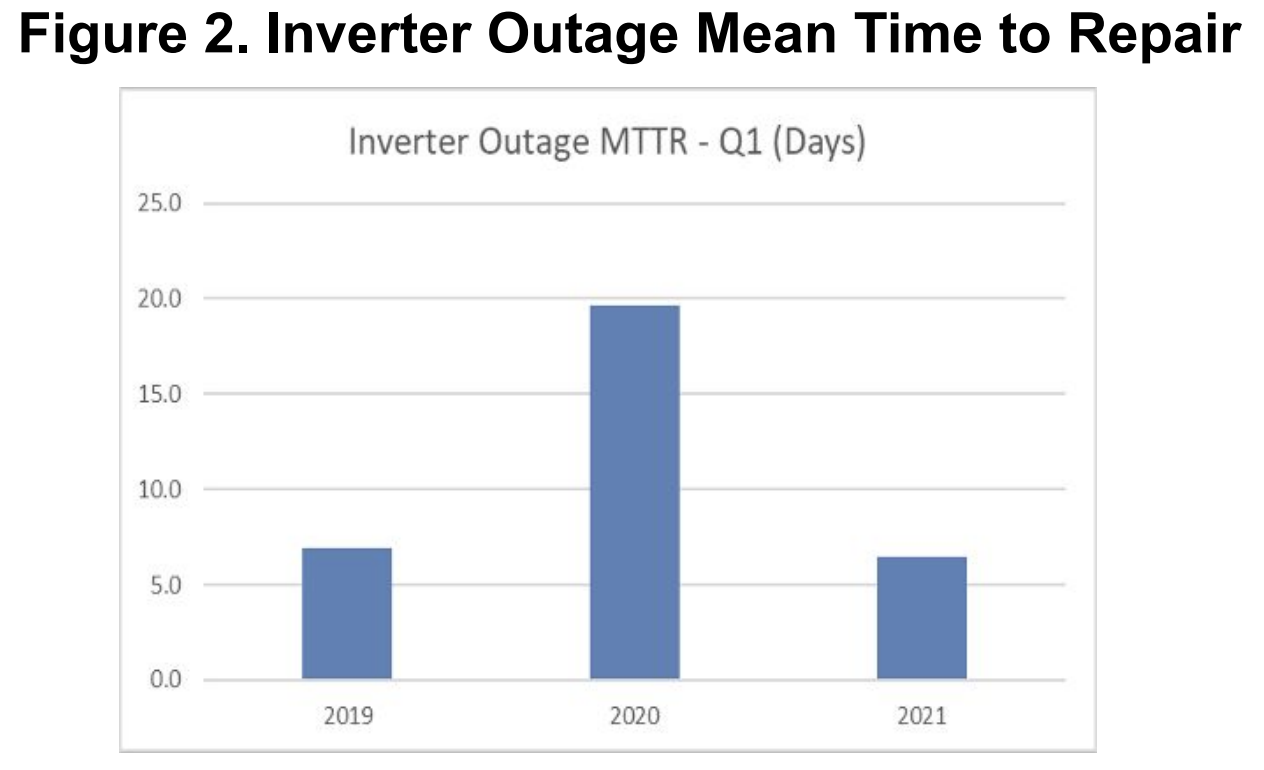
Lockdowns on travel became widespread in the United States in March of 2020 due to the COVID-19 pandemic. While utility workers were generally exempt from the lockdown, travel by original equipment manufacturer techs came to a near standstill unless the techs lived within driving distance from the site, which resulted in longer repair times. For example, inverter outages that required original equipment manufacturer on-site support went from a mean time to repair of 6.9 days in the first quarter of 2019 to 19.6 days in first quarter of 2020 and down to 6.5 days in 2021 as travel restrictions eased.
In February 2021, Winter Storm Uri caused approximately 70 percent of Texans to lose power. Most site and equipment designs did not anticipate the severe weather, causing inverters to trip offline and require original equipment manufacturer intervention. While most inverters were restored to service fairly quickly, some repairs were delayed due to flight cancellations. A day or two delay resulted in millions of dollars of lost revenue due to the $9,000 per megawatt-hour market price that resulted in ERCOT during the storm.
Weather
The report’s extreme weather risk section includes research from Clean Power Research which finds that wildfires reduced energy production in Western U.S. states by up to 6 percent on average in 2020. Last year was the most active wildfire season in the Western United States, as measured by acres burned and number of fires detected. Wildfires can cause problems for PV production, since the smoke from fires blocks out sunlight during the summer when production should be the highest. Additionally, residual soiling reduces production over an extended period.
Peak wildfire season occurred during the first few weeks of September where regions like the California Central Valley and Columbia River Basin in Oregon experienced a reduction of nearly 20 percent in monthly insolation. This insolation reduction was driven by both the duration and severity of the smoke created by the fires. In total, the three-month period of August to October 2020 amounted to a reduction of 5.8 percent of the typical-year energy output in the Central Valley. This means 2020 was the worst year on record (back to 2001) for tracking PV energy production in this location. It also means that certain PV projects’ financial performance loss was dominated by wildfire smoke, not clouds.
Conclusion
A number of factors affect solar panel system performance including weather and operational factors. kWh Analytics found that solar panel system performance degrades at 1 percent annually and that previous analyses underestimated the degradation by 0.5 percent. According to kWh Analytics, the industry has “significant work to do” when it comes to mitigating financial, operating and natural catastrophe risks. “Allowing these risks to go unchecked harms investment returns and ultimately damages the industry’s collective credibility.” These problems must be addressed by both the industry as well as the regulators who are basing assumptions of performance and economics upon what may be misleading projections.
