
American Wind Energy Association (AWEA) Interim CEO Robert Gramlich testified on April 16 before a joint hearing of the House Science Subcommittees on Energy and Oversight. In his testimony, Mr. Gramlich made several misleading claims about the efficiency and effectiveness of wind energy subsidies. The Institute for Energy Research has put together a list of those claims along with the corresponding facts.
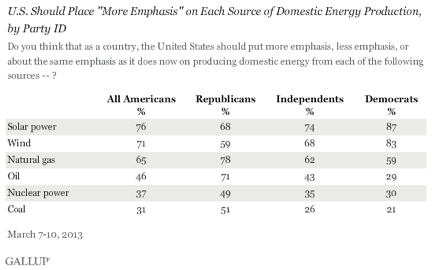
CLAIM: A recent Gallup Poll found that 71 percent of Americans want more emphasis on developing our wind resources.
FACT: The Gallup Poll Mr. Gramlich cites did ask Americans how much emphasis the U.S. should put on wind power production—with 71 percent indeed responding “more emphasis”—but Gallup’s survey did not ask respondents if they were willing to pay more for wind power. Numerous reviews such as this 2012 study have found that the average American is not willing to pay a substantial amount in addition to their current utility bill to have their power generated from mostly renewable sources, a consideration which may have yielded different results in the Gallup poll. According to the Energy Information Administration, wind is over 30 percent more costly to build than natural gas fired generation.
CLAIM: Last year, wind was the number one source of new electric generation capacity.
FACT: The large growth in wind installations last year was not indicative of a steady trend; rather, it occurred principally because the industry was unsure whether the federal wind Production Tax Credit (PTC) would be extended at the end of the year and thus expedited projects to meet the deadline. Being paid 2.2 cents per kwh (now 2.3 cents) by taxpayers to produce power whether it is needed or not for 10 years is a great inducement for the wind industry to build plants without regard to economic realities.
To this point, more than 13,000 Megawatts (MW) of wind power capacity was installed last year, which was almost double the amount installed in 2011 (6,819 MW) and 2010 (5,214 MW).[i] The same phenomenon was observed in 2009, when 10,000 MW of capacity was added in anticipation of the PTC’s expiration at the end of the year.
Moreover, with intermittent sources of power like wind, generation capacity is a less meaningful statistic than generation because wind’s variability means they are unable to produce the full amount of power possible over a longer period of time. The Energy Information Administration (EIA) uses a capacity factor of 33 percent for wind—which EIA notes is on the high end of its utilization range—meaning that a 50 MW wind property can only be expected to produce a maximum of 144,540 megawatt hours (MWh) of electricity per year, as opposed to a 50 MW nuclear plant with EIA’s given 92 percent capacity factor that would produce 402,960 MWh of electricity in a year.[ii]
To further underscore this key distinction, although wind was the number one source of added generation capacity last year, natural gas added more actual electricity generation than wind. From 2011 to 2012, natural gas added 217,019,000 Mwh of electricity produced, compared to 19,912,000 Mwh of added electricity produced by wind – in other words, natural gas added almost 11 times more actual generation than wind last year.[iii]
CLAIM: Already, Iowa and South Dakota produce enough wind energy to meet more than 20 percent of their electricity needs, and wind energy now produces more than 10 percent of the electricity in nine states.
FACT: Iowa and South Dakota may produce enough wind each year to equal 20 percent of their annual electricity consumption, but this does not mean that the electricity was actually needed and used when it was produced.
According to a 2012 study, the greatest amounts of wind generation occur when electricity demand is lowest—during the spring and fall and during the late evening and early morning hours—and coupled with the absence of storage, this means that wind generation cannot follow electricity demand. The same study’s analysis of wind availability across three key electricity markets showed that wind generation on the 10 highest demand days ranged from only 1.8 percent to 15.9 percent of total generation.[iv] As such, stating that gross wind production for 2012 was great enough to satisfy 20 percent of a state’s electricity needs is a less meaningful statistic for intermittent power than for traditional sources.
CLAIM: At least 74 electric utilities bought or owned new wind power installed in 2012, up 50% from a year ago.
FACT: This statistic neglects to mention the scale of the utilities that added wind power to their portfolio. It was recently announced that BP Wind Energy—the 10th largest owner of wind in the U.S. according to a December 2012 AWEA market brief—would be selling off its wind properties in the United States. It also fails to mention that the reasons they buy wind are two-fold: state mandates that require them to purchase renewable energy and an enormous tax credit from the U.S. taxpayers, which in some cases is near the actual wholesale price of the electricity produced. When the government forces some business to buy something, and then pays them to buy it, they buy it.
CLAIM: Americans are getting a good deal on wind energy. The benefits described above come at a very modest cost.
FACT: Wind energy is anything but a “good deal” for Americans. As the Government Accountability Office reports, wind energy is subsidized through dozens of different federal credits, grants, and loan guarantees, and many of these programs give wind producers unparalleled advantages over other more reliable sources of energy.
For example, the two-decades old wind PTC gives wind producers $23 per MWh to produce power regardless of whether or not it is needed. At $23/per MWh, the PTC is worth more than half of the entire average wholesale price of electricity in the country.[v]
Moreover, wind is not the economic driver AWEA claims it to be. Last year, the wind industry optimistically estimated that the one-year PTC extension would save 37,000 jobs. Divided into the PTC’s $12.1 billion cost, each wind job theoretically cost the taxpayer $327,000.
A much better deal would be electricity that Americans aren’t compelled by law to purchase through their utilities, and electricity that doesn’t require massive subsidies by taxpayers. Or even electricity that worked all the time.
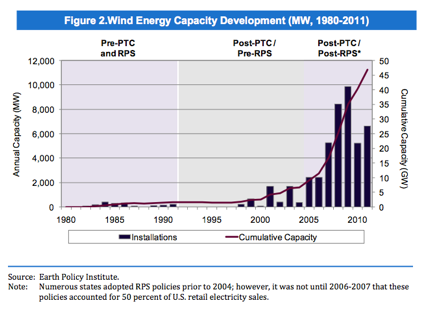
CLAIM: A single incentive, the Production Tax Credit, is by far the dominant policy driver for wind energy in the US.
FACT: An analysis of the growth in wind installations over the past two decades shows that the increase in wind power is more closely aligned with the implementation of state renewable portfolio standards (RPS) in 29 states and the District of Columbia, rather than with the enactment of the wind PTC.[vi]
CLAIM: Wind energy and the federal tax credits that support it are still a great deal for America. It would be wrong to use this report to conclude otherwise, as… it suggests that 82 initiatives support wind, when only two are truly wind-specific.
FACT: Just because an incentive isn’t wind-specific, doesn’t mean it isn’t duplicative with other programs. On top of the $23 per MWh credit that wind producers receive, many of them have also benefited from the $20 billion in cash grants given to wind projects under the Section 1603 program, and receive the benefit of renewable mandates by states requiring people to buy their electricity. Forcing people to buy your product at the point of the government’s gun probably doesn’t constitute a good deal…at least for the purchaser.
CLAIM: Fewer than 1% of wind projects installed from 2009-2012 took both a tax incentive and a DOE loan guarantee.
FACT: Given that the DOE loan guarantee has only given money to 33 projects, and only 4 of those were wind generation projects, it is entirely within reason that only 1 percent of wind projects installed over the period given by AWEA accepted both tax incentives and a loan guarantee. The more important metric would be, how many of the dozens upon dozens of wind projects added in that time period took both a Section 1603 grant and a tax incentive?
[i] AWEA Wind Industry Fast Facts, http://www.awea.org/learnabout/industry_stats/index.cfm?CFID=285371858&CFTOKEN=84274678&jsessionid=7830427a5c7ae1ec06802164172a6c93c7a4
[ii] MWh/year calculation for wind vs. nuclear plants found using following calculation: 50 MW * 8760 hours/year * capacity factor (.33 or .92).
[iii] Energy Information Administration, Monthly Electricity Review: Electricity Net Generation Total for All Sectors, http://www.eia.gov/totalenergy/data/monthly/pdf/sec7_5.pdf
[iv] William Lesser, “The Wind PTC: A High Cost Subsidy for Low Value Power,” October 2012, http://continentalecon.com/publications-ce/.
[v] According to the Energy Information Administration’s 2012 wholesale electricity price data, the average high price for electricity in the 10 electricity markets was $34.45 per MWh and the average low price was $33.05 per MWh, Source:http://www.eia.gov/electricity/wholesale/.
[vi] David Dismukes, “Removing Big Wind’s Training Wheels: The Case for Ending the Production Tax Credit,”http://www.americanenergyalliance.org/wp-content/uploads/2012/10/Dismukes-Removing-Big-Winds-Training-Wheels.pdf.
