
On June 6, 2019, the American Wind Energy Association (AWEA) posted a blog criticizing the IER/ACCCE June 3, 2019 report entitled Levelized Cost of Electricity from Existing Generation Resources. But AWEA could not have read the June 3, 2019 IER/ACCCE report carefully because AWEA quotes levelized cost numbers from IER’s 2016 predecessor report. And, as usual, AWEA presents a one-sided, positive case for the wind industry, by quoting the lowest levelized cost estimates from various reports, rather than providing the range of estimates, and by quoting numbers that include subsidies for wind and solar power that are paid by taxpayers. These subsidies are being phased out by law, so to provide numbers with the subsidies included is misleading. Several of the AWEA comments are discussed below with corresponding IER responses.
AWEA Comment: “Wind power purchase prices averaged $18.91/megawatt hour (MWh) in 2017.”
Response: The hyperlink AWEA provides does not document the $18.91/MWh power purchase agreement price. Nonetheless, note that AWEA confuses power purchase agreements and cost, which are not the same. A power purchase agreement, or electricity power agreement, is a contract between two parties, one which generates electricity (the seller) and one which is looking to purchase electricity (the buyer). According to the Energy Information Administration (EIA), a levelized cost is “the cost (in real dollars) of building and operating a generating plant over an assumed financial life and duty cycle.”
If one were to treat the $18.91/MWh as a cost, as AWEA is suggesting, and add in the $23.00/MWh production tax credit, the unsubsidized purchase price would be $41.91/MWh. However, such numbers are meaningless without the corresponding cost of other competitive plants, which one can see in the next comment/response.
AWEA Comment: “The utility Xcel Energy has indicated its recently announced wind projects have a levelized price of $15-25/MWh. These purchase prices include the federal tax credit for renewable energy, which further reduces the cost of renewable energy to consumers.”
Response: AWEA did not provide the full statement in the Xcel document, which is “Xcel’s new wind installations would produce energy at a cost of 1.5 to 2.5 cents per kilowatt hour, which compares favorably to the 2.3 to 2.4 cents per-kilowatt-hour costs of Xcel’s Sherco coal generators.” Adding in the production tax credit, the levelized cost of Xcel’s new wind projects would be closer to $40 to $50/MWh. Xcel’s new wind projects therefore are about double the cost of the existing coal generators when comparing the two without the production tax credit. Clearly, taxpayers are making wind economic compared to coal plants and forcing unsubsidized coal plants to retire prematurely.
What is more, by adding “which further reduces the cost of renewable energy to consumers,” AWEA implies that the federal tax credit is an afterthought, when in reality it is a key component of wind energy’s business model.
AWEA Comment: “(T)he IER authors reach the wrong conclusions because their assumed costs for wind and solar energy are three to four times higher than all estimates by independent experts, as shown below.”
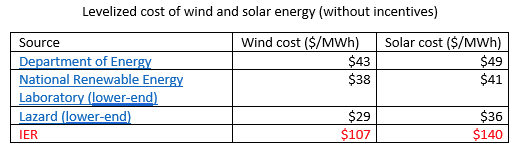
Response: First, please be advised that the levelized cost numbers that AWEA cites for IER in this table are from IER’s 2016 levelized cost report, not its 2019 report. Note also that AWEA is providing the lower bound of the estimates from NREL and Lazard. If AWEA provided the range of estimates from each of the reports, the table would look as follows:
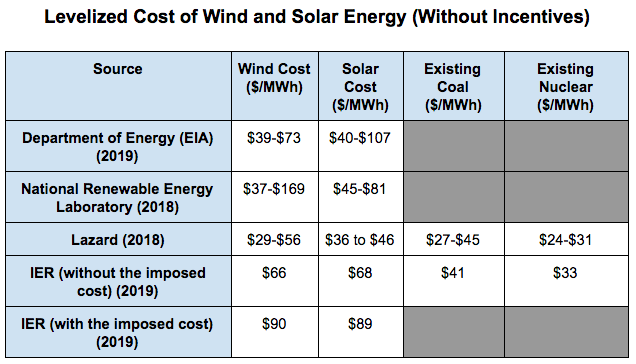
Seeing the range of costs provides a more complete picture and shows that Lazard’s upper bounds for the cost of wind and solar are distinct outliers. Also note that Lazard’s marginal levelized cost for existing coal and nuclear shows that they are competitive with Lazard’s unsubsidized wind and solar levelized cost. IER’s levelized cost for existing coal and nuclear are for average coal and nuclear plants and are at the high end of Lazard’s marginal costs for existing coal and nuclear.
AWEA Comment: “Part of the problem is that they use old data for the productivity of wind and solar plants. The authors use the average productivity of the entire fleet of wind and solar plants that are currently operating, which misses that new plants are far more productive than those installed even a few years ago. This error adds $10.50/MWh to wind costs and $7.70/MWh to solar costs. In reality, solar capacity factors have increased 23 percent since 2010, while wind capacity factors are up 41 percent since 2009. Partially as a result, wind’s costs have fallen by 69 percent since 2009.”
Response: IER’s levelized cost for new wind and solar are based on the EIA’s levelized cost numbers noted in the table above, adjusted for average capacity factors for the wind and solar industries over the past five years, whereas EIA’s capacity values are for the best available wind or solar plant. The best available capacity factor for wind (41 percent) is 19 percent higher than the average capacity factor for wind over the past 5 years (35 percent), and the best available capacity factor for solar (29 percent) is 13 percent higher than the average over the past 5 years (26 percent). A 5-year range was used for the capacity factors to capture the variability in the wind and solar resource. The 5-year data can be found in this EIA data table.
AWEA Comment: “The report then compounds that error by inventing other cost adders. Most notably, the report incorrectly claims that adding renewable generation requires the addition of conventional generation. First of all, almost all U.S. regions already have excess power plant capacity. More importantly, adding wind or solar to the power system always provides positive capacity value to the power system to help meet electricity demand, and therefore reduces and never increases the need for conventional power plant capacity. Due to that error alone, the report incorrectly adds an ‘imposed cost’ of $23.6 per MWh to wind generation and $21/MWh to solar generation.”
Response: The IER/ACCCE report did not say that wind and solar generation requires additional conventional generation. The report said that conventional generators would produce fewer megawatt hours per year, yet have almost the same fixed costs. Because wind and solar generators are not dispatchable (as coal, natural gas, and nuclear power are), the IER/ACCCE study put them on a comparable basis by adding imposed costs to the levelized cost of wind and solar generation. By including the costs imposed on the system, those generators can be compared more directly with dispatchable resources. Imposed costs are the costs of keeping dispatchable plants available when wind or solar generation fall off to maintain electric grid reliability. Note that EIA realizes there is a distinction by differentiating between “dispatchable” and “non-dispatchable” technologies when it produces its LCOE tables. (See Table 1a and Table 1b.)
The IER/ACCCE analysis assumed that natural gas combined cycle technology would supply the power needed when wind was not available and a combination of natural gas combined cycle and natural gas turbines would supply the power when solar PV was not available. The calculation, which is documented in the analysis chapter of the IER/ACCCE report, finds that the imposed cost to be added to the levelized cost of wind power is $23.6 per megawatt hour and the imposed cost to be added to the levelized cost of solar power is $21 per megawatt hour. Adding in those costs makes the cost of new wind and solar power each two to three times more expensive than the cost of generating electricity from the lower end of the range of estimates for new wind and solar by the other researchers noted in the table, not three to four times as AWEA claims.
Note that imposed costs are an unavoidable cost of generating electricity with wind and solar power since they are not dispatchable technologies and studies that do not include them are misleading. Demonstrating that fact is the purpose of the IER/ACCCE study. As the study indicates, the levelized cost of wind and solar power cannot be compared with the levelized cost of dispatchable resources unless imposed costs are included.
AWEA Comment: “In addition, the study lowballs estimates for the contribution of wind and solar to meeting peak capacity needs. The authors give solar credit for only 12.9 percent of its installed capacity, while many grid operators have shown solar’s contribution to be roughly five times higher. They similarly understate wind’s contribution by a factor of nearly three.”
Response: The source AWEA provides that shows “solar’s contribution to be roughly five times higher” uses the PJM Manual 21 to define the procedures for estimating the capacity value of intermittent resources, such as wind and solar PV generators. “The manual defines capacity value of the intermittent resource (in percentage terms) as the average capacity factor that the resources have exhibited in the last three years during the summer period. The summer period is between the hour beginning at 2 PM and the hour ending at 6 PM, local time, during the months of June, July, and August.” Because the report is using the time when solar has its greatest contribution (from 2 PM to 6 PM and for the months of June, July, and August), it is no wonder that solar’s contribution is five times higher than what is used for the average national year-round, 24/7, capacity value in the IER/ACCCE report. We use the year-round average because people demand electricity year-round.
As the IER/ACCCE report states on page 25:
“PJM calculates capacity value for wind and solar only across the hours from 2PM to 6PM during June, July and August, then counts the average capacity factor of wind or solar across those hours as their potential firm capacity contribution which can be bid into the RTO’s capacity auctions.
This results in a generous firm capacity valuation of intermittent over dispatchable resources in 3 respects:
1. Many peak load hours occur after 6 PM or in other months.
2. Over-generation during peak-load hours is valued as highly as the avoidance of shortfall.
3. Wind and solar fall short of their firm capacity allowance during about half of peak-load hours.
Consequently, we adopted the method for computing firm capacity recommended by Potomac Economics, Midcontinent ISO’s market monitor, in its 2012 State of the Market Report and applied it across the combined PJM and MISO regions.”
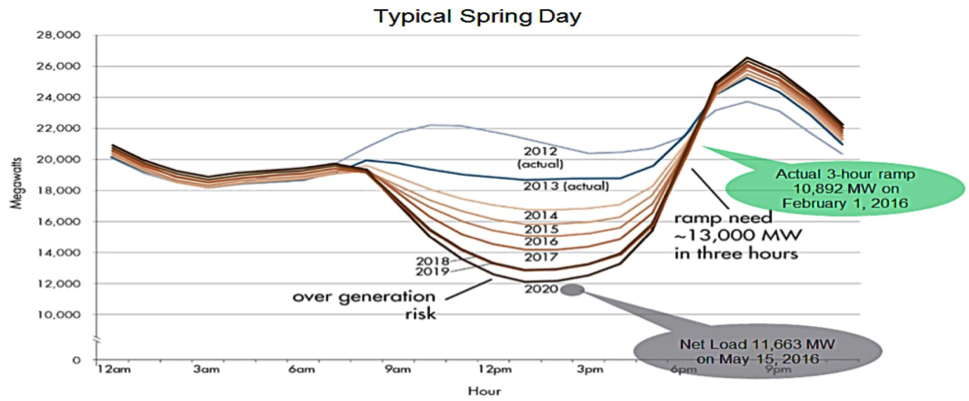
Further, on page 28 of the IER/ACCCE report, the authors reproduced the California Independent System Operator’s “Duck Curve” published in 2012. Examining the duck curve, it is clear that solar’s capacity value during peak evening hours cannot be 65 percent, as AWEA suggests.
AWEA Comment: “IER’s convoluted ‘imposed cost’ method is not necessary, as the Department of Energy’s Energy Information Administration (EIA) has already developed a method that accurately accounts for the different energy and capacity value of all energy sources, fully accounting for differences in their dispatchability and time of production. That method shows that the value of wind energy is only $4.60/MWh, or about 12 percent lower than that of more dispatchable gas combined cycle generation, while solar generation is actually $2/MWh more valuable than gas combined cycle generation.”
Response: AWEA is referring to EIA’s calculation of the Levelized Avoided Cost of Electricity (LACE), which EIA provides to demonstrate the value of a plant’s output to the grid when generating power. As EIA states, avoided cost provides a proxy measure for potential revenues from sales of electricity generated from a candidate project. EIA does not use this avoided cost calculation in its model of the National Energy Modeling System. EIA developed the avoided cost methodology to explain why intermittent technologies were not penetrating the model as some believed should be the case due to just the levelized cost of wind and solar alone. The two cost measures need to be analyzed in conjunction with each other. AWEA simply subtracted the levelized avoided cost of wind and solar from that of natural gas combined cycle to get the numbers quoted above, which is not the same measure as the imposed costs in the IER/ACCCE report.
According to EIA, LACE is primarily a function of the cost of the generation that a new plant would displace when that new plant is available. Thus, EIA’s LACE calculation provides a higher value for solar PV compared to a natural gas combined cycle plant when a solar plant is generating power and displaces the natural gas combined cycle plant. But, solar cannot provide that higher capacity value when the sun isn’t shining. That is, solar generation is low or non-existent during many near-peak hours in the evening in summer and fall. Thus, it has zero capacity value at those hours, which must be filled by dispatchable generators. As such, EIA’s LACE is not the same as the imposed cost in the IER/ACCCE report despite AWEA’s attempt to make a one-to-one connection.
AWEA Comment: “The cost of reliably integrating large conventional power plants is actually larger than that of renewable resources, as data from Texas indicate. That means accurately accounting for integration costs and other costs imposed on the system would actually indicate a net benefit from increasing use of renewable energy. Large conventional power plants can fail instantly and without warning, and therefore require more expensive, faster-acting operating reserves than the slower-acting reserves used to accommodate gradual and predictable changes in wind and solar output. Regardless, in Texas both costs are well under $1/MWh, while the Midwest regional grid operator has noted that the impact of wind generation on its need for fast-acting reserves is ‘little to none.’”
Response: Large conventional power plants supplied the nation’s power grid reliably for long before wind and solar power started penetrating the system because of lucrative federal subsidies and state mandates that forced renewable generation into the system. States that have forced a sizeable amount of wind and solar generation into their power system have realized much higher electricity prices.
Average electricity prices in the United States increased 7 percent from 2009 to 2017 while electricity from solar and wind increased from two to eight percent. During this period, demand for electricity wasairly flat so little new capacity needed to be built. The states of South Dakota, North Dakota, Oklahoma, Kansas, Texas, and Iowa receive about 30 percent or more of their generation from wind and solar power today, but that increase was accompanied by an increase in their electricity prices, as follows:
• In North Dakota, electricity prices increased 32 percent while electricity from solar and wind grew from nine to 27 percent between 2009 and 2017.
• In South Dakota, electricity prices increased 36 percent while electricity from solar and wind grew from five to 30 percent between 2009 and 2017.
• In Kansas, electricity prices increased 33 percent while electricity from solar and wind grew from six to 36 percent between 2009 and 2017.
• In Iowa, electricity prices increased 18 percent while electricity from solar and wind grew from 14 to 37 percent between 2009 and 2017.
• In Oklahoma, electricity prices increased 18 percent while electricity from solar and wind grew from four to 32 percent between 2009 and 2017.
Americans deserve transparency in their electricity markets, rather than obfuscation. Electricity pricing is heavily affected by layered governmental interventions, and is not clear to most of the public. It is our hope that the IER/ACCCE report will clarify some of the discussion, and enable the public to better understand the actual prices and functions of the markets that affect their lives.
AWEA Comment: “Large coal and nuclear power plants are also inflexible, in that they are unable to quickly change their level of output in response to fluctuations in electricity demand, which imposes a cost on the power system and other power plants. As a result, the Independent Market Monitor for the Midwest grid operator has found that coal plants account for the vast majority of the region’s generation scheduling error and associated operating costs. In contrast, most wind and solar plants are now fully dispatched by grid operators through electricity markets, and can respond hundreds of times faster than conventional power plants.”
Response:
It may be true that solar and wind plants can be dispatched faster than conventional power plants when the wind is blowing and the sun is shining. But what happens when the wind isn’t blowing and the sun isn’t shining, which is the case for about two-thirds, on average, of a typical day? Then, those plants that take a few hours to rev up must be thrown into action, so that the American public can get power 24 hours a day/7 days a week at the touch of a light switch. IER and ACCCE believe that the American public would prefer a plant that is available 24/7 to one that operates only a third of the day, on average, if they had a choice.
