
Introduction
The massive growth in AI-electricity demand at data centers has sparked growing concern about rising electricity demand and prices. Commentators increasingly argue that the rapid expansion of data-center infrastructure is pushing up electricity prices and imposing hidden costs on households. It is an intuitive narrative as data centers consume large amounts of electricity, demand is rising quickly, and prices in some regions have increased much faster than inflation in recent years. As a result, some politicians and activist groups have rallied around the idea that data centers are driving up electricity prices. Some are even calling for a moratorium on new data centers. But does the data support this intuition? The answer is no. Although data center growth is helping to drive demand higher, it does not explain why electricity prices have risen significantly in some parts of the country.
The latest data from the Energy Information Administration (EIA) on electricity prices and sales contradict the narrative that data centers are driving up electricity prices. That may change in the future, but the most recent data shows that data centers are not responsible for higher electricity rates.
There is no statistically significant correlation between the number of data centers in a state and its current electricity prices. In fact, prices in the top ten data center states are virtually identical to the average across other states. Furthermore, there is no statistically significant relationship between data center concentration and faster increases in electricity rates.
Data Center Electricity Demand Is Growing Massively
According to a 2024 Lawrence Berkeley National Laboratory (LBNL) report prepared for the U.S. Department of Energy, U.S. data centers consumed about 76 terawatt-hours (TWh) in 2018 and roughly 176 TWh by 2023, a 131% increase in five years. LBNL attributes the surge primarily to a larger server base and rapid deployment of GPU-accelerated systems for AI workloads. Company disclosures show similar growth at the facility level: Meta’s metered data-center consumption rose from 6.97 TWh in 2020 to 18.06 TWh in 2024 (up 159%), with major campuses in Oregon, Iowa, and Nebraska more than doubling.
The relevant policy question, then, is not whether data center electricity use is rising but whether that growth is driving higher retail electricity prices. That is a narrower empirical question, and one that state-level data can test.
What is Going on with Electricity Prices in the States, Especially Those with the Most Data Centers?
We examined EIA electricity price and sales data for all 50 states, paired with 2025 state-level data center counts. We ran two sets of tests: first, whether states with more data centers experience faster growth in electricity consumption; and second, whether states with higher or faster-growing electricity consumption experience faster increases in retail prices.
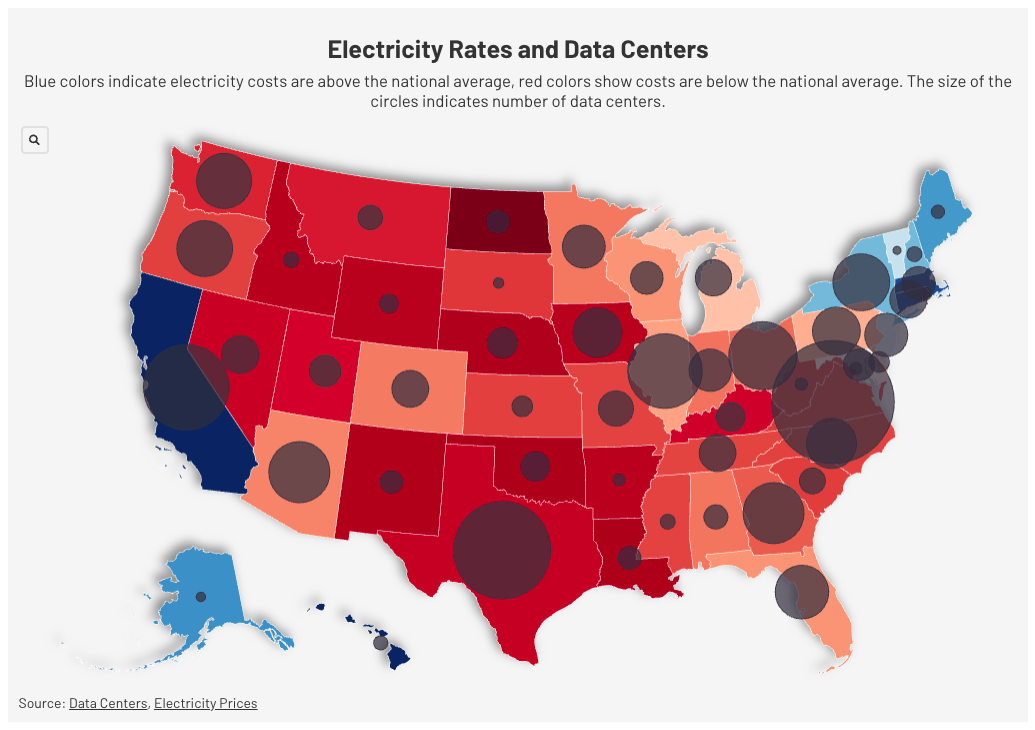
To understand what the data looks like, see the two graphics below. The first shows current electricity rates with circles representing the number of data centers. Blue indicates electricity costs above the national average, and red indicates rates below it.
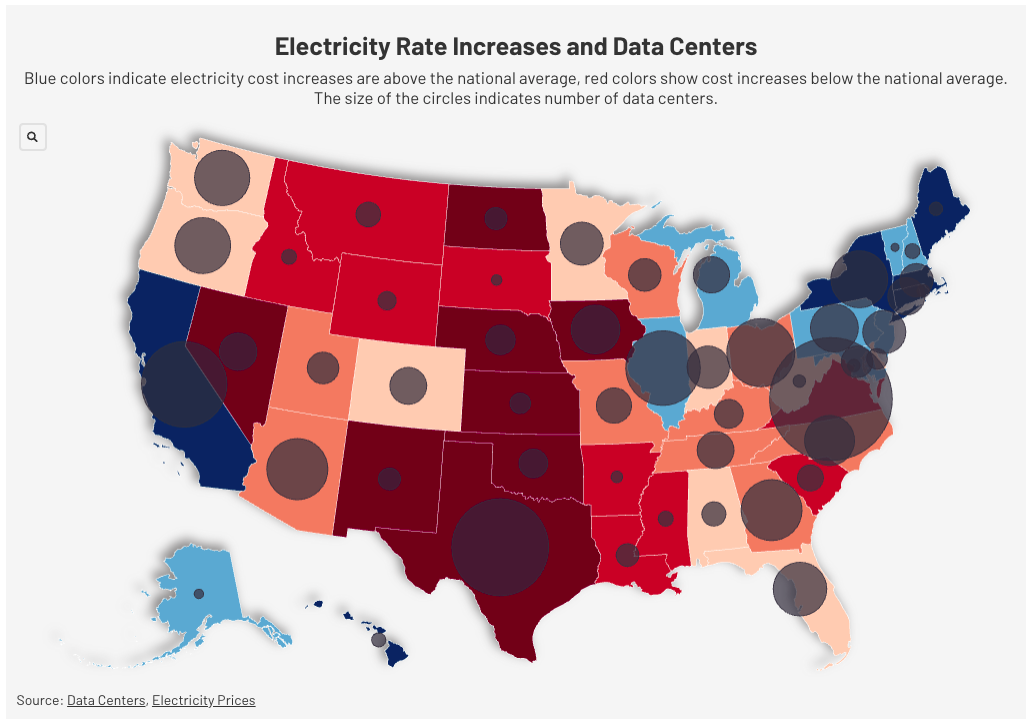
The second graphic shows electricity price increases from 2015-2025 across the states, with blue indicating higher increases and red indicating lower increases (and even price declines in North Dakota and New Mexico). The circles represent the number of data centers in the state. The circle for the number of data centers in Virginia is massive because Virginia is the home to the world’s largest concentration of data centers.
From the data, it appears that other factors, such as those policies preferred by Democrat-led states and those by Republican-led states, lead to the discrepancy in electricity rates, not data centers. We examined that issue in our recent paper, Blue States, High Rates.
To better understand the data, what do the statistics say?
Question 1: Do data centers correlate with current electricity prices?
No. The number of data centers does not correlate with current electricity prices. (The Pearson r = -0.053 (p = 0.72)). This is essentially zero correlation and not significant. States with many data centers don’t have higher or lower electricity prices than states with few data centers. In fact, the top 10 data center states (Virginia, Texas, California, Illinois, Ohio, etc.) average 14.46¢/kWh in 2025, virtually identical to the 14.39¢/kWh average for all other states. This makes some intuitive sense as data centers actually seek out states with cheap, reliable power, so the causality likely runs the opposite direction.
Question 2: Do data centers correlate with faster price increases?
There’s a slightly positive but still statistically insignificant relationship between data centers and fast price increases. Comparing the top 10 data center states vs. everyone else:
- 2015–2025 price change: 36.3% vs. 28.1% (t-test p = 0.144 — not significant)
- 2021–2025 price change: 26.5% vs. 21.1% (t-test p = 0.228 — not significant)
The Spearman rank correlation for data centers vs. the recent 2021–2025 rate change is ρ = 0.247, the strongest signal in the data and the only one approaching marginal significance (p = 0.083). That’s a weak positive trend, but it fails conventional significance thresholds and disappears with linear (Pearson) correlation (r = 0.128, p = 0.374). The longer 2015–2025 window yields an even weaker result: Spearman ρ = 0.142 (p = 0.326), Pearson r = 0.099 (p = 0.494).
Question 3: What does the data say about increasing electricity sales? Data centers will increase electricity demand, but will that increase be associated with higher electricity prices?
Does rising electricity demand lead to higher prices? No. The relationship runs sharply in the opposite direction, which is one of the strongest findings in the entire dataset.
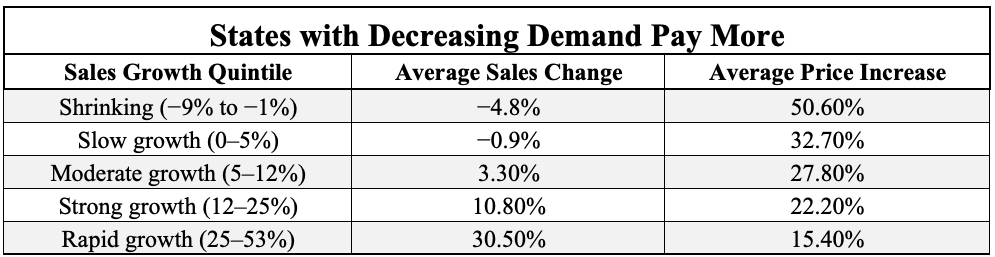
Across all 50 states, states where electricity sales grew faster from 2015 to 2025 paid less, not more, for electricity. States where sales declined paid dramatically more. Comparing above-median and below-median sales growth states:
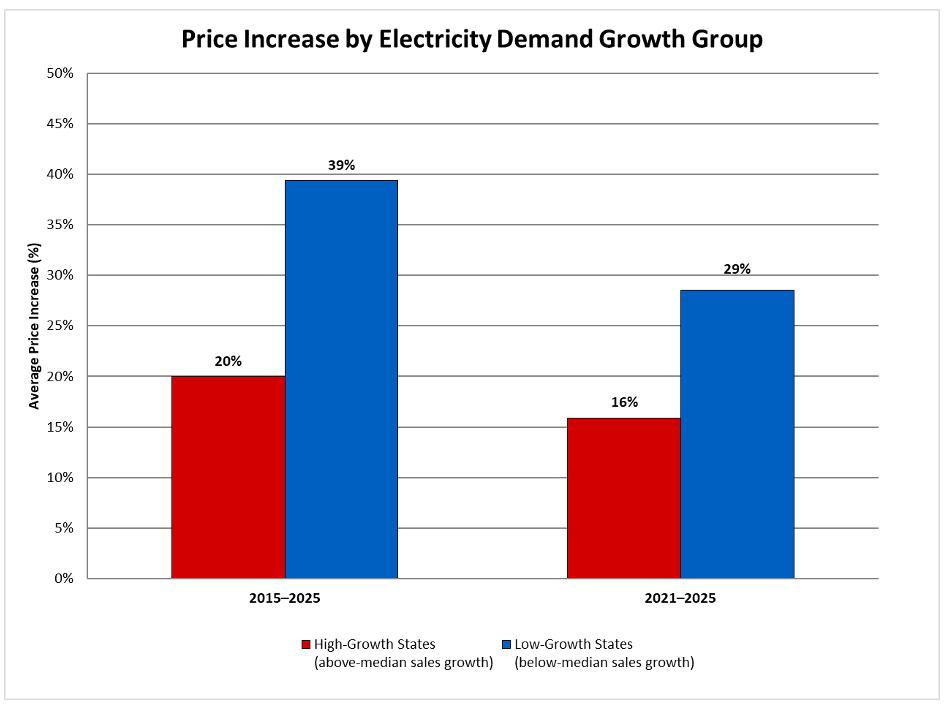
- 2015–2025: High-growth states averaged a 20.0% price increase; low-growth states averaged 39.4% (t-test p < 0.0001)
- 2021–2025: High-growth states averaged a 15.9% price increase; low-growth states averaged 28.5% (t-test p = 0.0002)
The correlations confirm this is not a fluke. For 2015–2025: Pearson r = −0.710 (p < 0.0001), Spearman ρ = −0.807 (p < 0.0001). For 2021–2025: Pearson r = −0.643 (p < 0.0001), Spearman ρ = −0.574 (p < 0.0001). A Spearman rank correlation of −0.807 across 50 states indicates an exceptionally strong relationship in the cross-sectional policy data, stronger than that of virtually any other variable in this analysis.
The state-level examples are stark. The five states with the largest sales declines from 2015 to 2025:
- California (−9%)
- Maine (−7%)
- Connecticut (−6%)
- Massachusetts (−5%)
- Hawaii (−4%)
These states saw average price increases of 58%.
The five states with the largest sales gains:
- North Dakota (+67%)
- New Mexico (+37%)
- Texas (+32%)
- Oregon (+30%)
- Virginia (+29%)
These states saw average price increases of only 13%, and North Dakota actually saw prices fall 6%.
The intuition behind this result is straightforward. Electricity grids entail high fixed costs, transmission infrastructure, and generation capacity, as well as long-term contracts that must be recovered regardless of how much power flows through them. When sales grow, those fixed costs are spread across more kilowatt-hours, holding per-unit rates down. When sales fall or stagnate, the same fixed costs are recovered from a shrinking base, pushing rates up. The data are consistent with exactly that dynamic playing out in the high-mandate, low-growth states over the past decade.
Conclusion
The state-level data firmly rejects the narrative that data centers drive up electricity prices. That may or may not change in the future, but the most recent data shows that data centers are not responsible for higher electricity rates. The data shows no statistically significant correlation between the number of data centers in a state and its current electricity prices. In fact, prices in the top ten data center states are virtually identical to the average across all other states. Furthermore, there is no statistically significant relationship between data center concentration and faster rate increases.
Instead, the data reveals a starkly opposite trend: rising electricity demand is associated with smaller price increases. Because electrical grids rely on high fixed costs, such as transmission infrastructure and generation capacity, increasing sales spreads these costs across more kilowatt-hours, holding per-unit rates down. Therefore, states experiencing rapid sales growth often see minimal rate increases, while states with shrinking demand are forced to recover fixed costs from a smaller base, leading to dramatic price hikes. Ultimately, the discrepancy in electricity rates across the country is driven more by state-level policies than by the proliferation of data centers.
Download the full report here.
