
![]()
The Energy Information Administration (EIA) produces forecasts of energy supply and demand for the next 20 years using the National Energy Modeling System (NEMS)[1]. These forecasts are updated annually and published in the Annual Energy Outlook (AEO).[2] All sectors of the energy system are represented in NEMS, including the electric power generation, transmission, and distribution system.
To meet electricity demand, the EIA represents existing generating plants, retires those that have come to the end of their economic life, and builds additional plants to meet projected demand from the residential, commercial, industrial, and transportation sectors. As a result, EIA must represent a slate of technologies, their capital and operating costs, their availability and capacity factors, the financial structure and subsidies, the time to construct the plant, the utilization of the plant, and expected future cost changes, including fuel input for fossil and nuclear plants.
To determine the most economic technology for the type of demand (base, intermediate, or peaking load) for which new capacity is needed, NEMS competes the technologies using their levelized costs as one measure of competitiveness. Levelized costs represent the present value of the total cost of building and operating a generating plant over its financial life, converted to equal annual payments and amortized over expected annual generation from an assumed duty cycle.
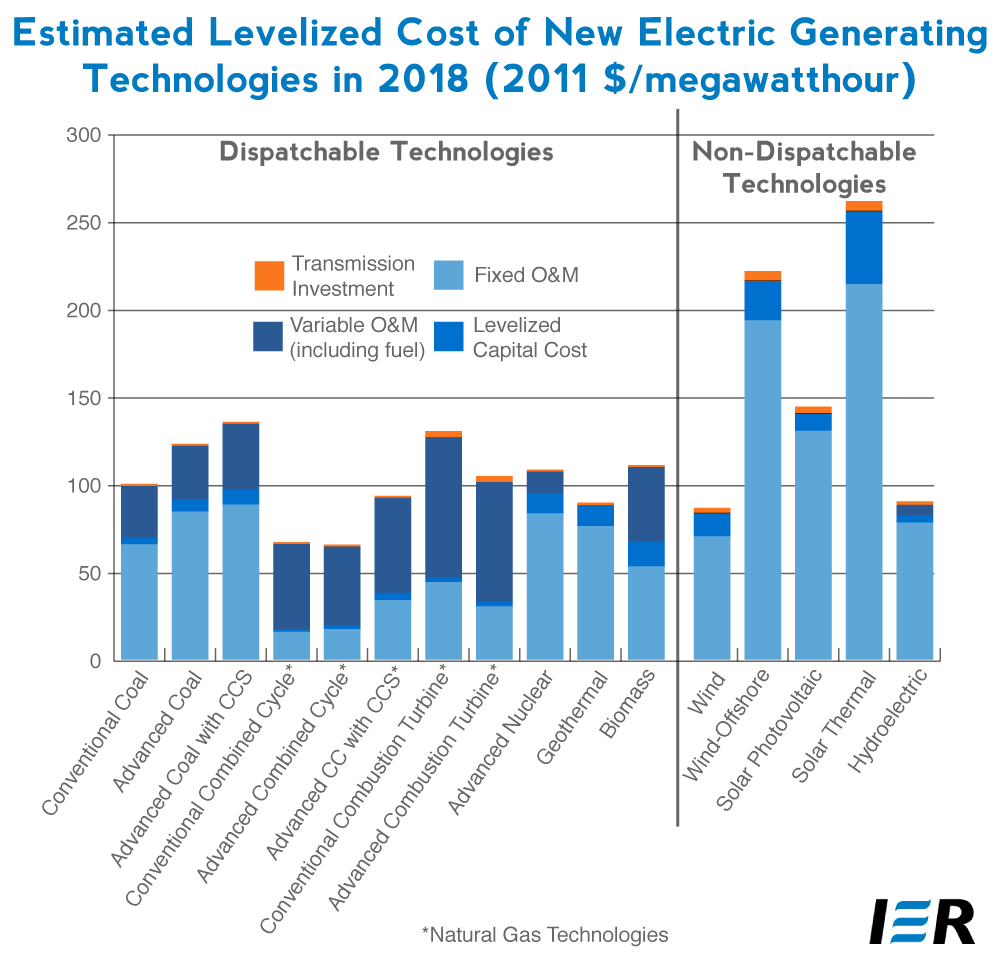
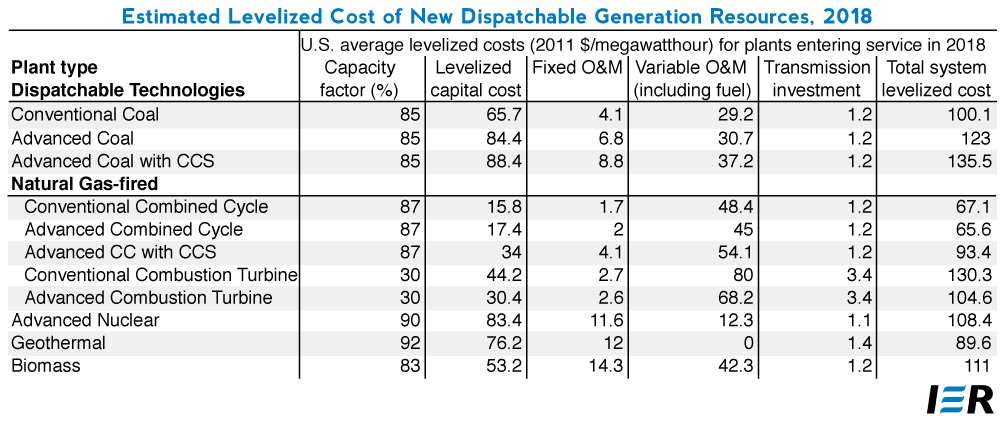
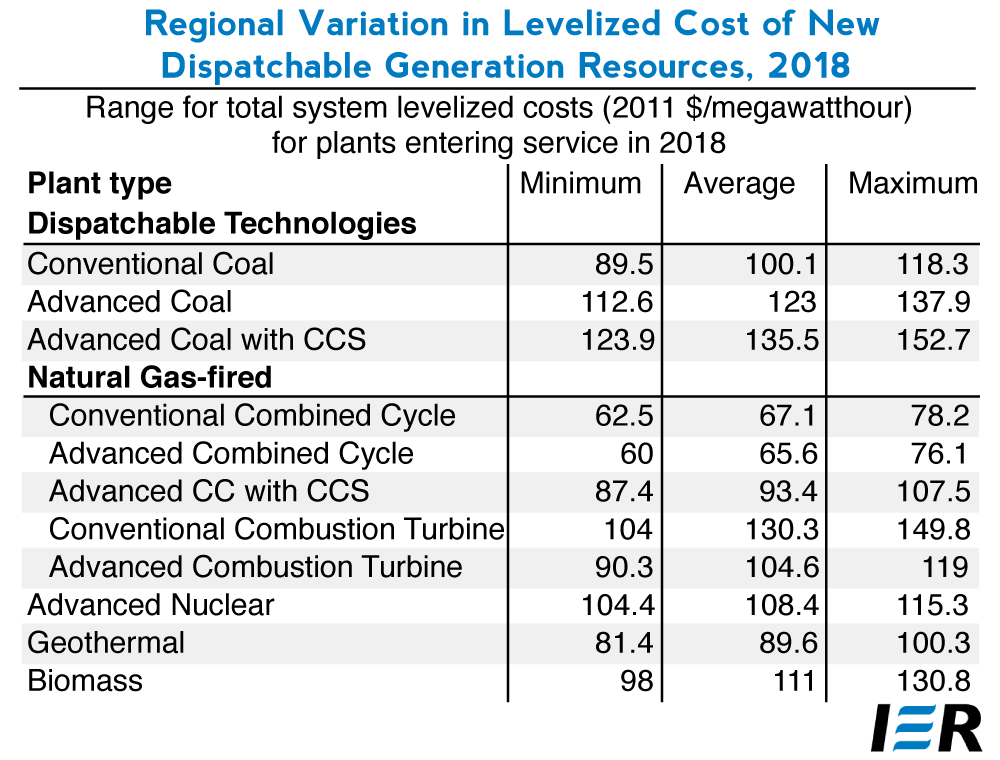
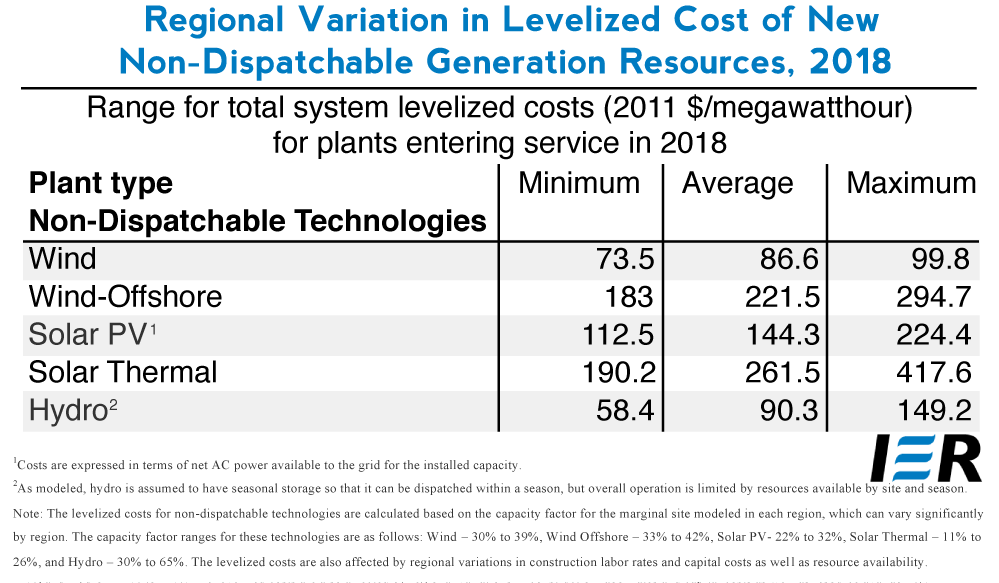
The first table below provides the average national levelized costs for the generating technologies represented in the AEO2013 reference case.[3] The values shown in the table do not include financial incentives such as state or federal tax credits, which impact the cost and the competitiveness of the technology. These incentives, however, are incorporated in the evaluation of the technologies in NEMS based on current laws and regulations in effect at the time of the modeling exercise, as well as regional differences in the cost and performance of the technology, such as labor rates and availability of wind or sun resources. Due to the regional differences in the cost of labor, fuel, and other factors that affect the levelized generation cost, a second table is provided below that gives the range of levelized costs based on these differences.
The levelized cost for each generation technology are calculated based on a 30-year cost recovery period, using a real after tax weighted average cost of capital of 6.6 percent. In the AEO2013 reference case, a 3-percentage point increase in the cost of capital is added when evaluating investments in greenhouse gas intensive technologies such as coal-fired power plants without carbon capture and sequestration (CCS) technology and coal-to-liquids plants. The 3-percentage point adjustment is similar to a $15 per ton carbon dioxide emissions fee when investing in a new coal plant without CCS technology. This adjustment represents the implicit hurdle being added to greenhouse gas intensive projects to account for the possibility that they may need to purchase allowances or invest in other greenhouse gas emission-reducing projects that offset their emissions in the future. Thus, the levelized capital costs of coal-fired plants without CCS are likely higher than most current coal project costs.
The levelized cost for each technology is evaluated based on the capacity factor indicated, which generally corresponds to the maximum availability of each technology. However, some technologies, such as a conventional combined cycle turbine, that may look relatively expensive at its maximum capacity factor may be the most economic option when evaluated at a lower capacity factor associated with an intermediate load rather than base load facility.[4]
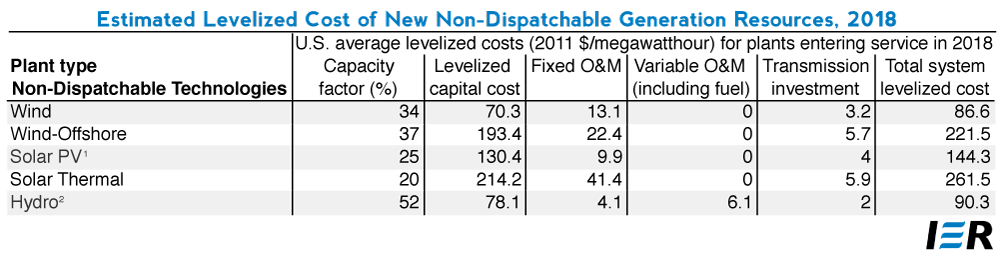
Simple combustion turbines (conventional or advanced technology) are typically used for peak load, and are thus evaluated at a 30 percent capacity factor. Intermittent renewable resources, e.g. wind and solar, are not operator controlled, but dependent on the weather or the sun shining. Since the availability of wind or solar is dependent on forces outside of the operator’s control, their levelized costs are not directly comparable to those for other technologies although the average annual capacity factor may be similar. Because intermittent technologies do not provide the same contribution to system reliability as technologies that are operator controlled and dispatched, they may require additional system investment as back-up power that are not included in the levelized costs shown below.
EIA warns against the direct comparison of the levelized costs across technologies as the sole measure of economic competitiveness because of differences in resource mix, capacity values, and utilization rates across regions. Rather, the agency suggests that the levelized avoided cost, which measures the cost to the grid to generate the electricity that is being displaced by the new generation project, also be used, but is not provided. According to EIA, “The economic decisions regarding capacity additions in EIA’s long-term projections reflect these concepts rather than simple comparisons of levelized project costs across technologies.”
What EIA is expressing is that dispatchable technology costs should not be compared to non-dispatchable technology costs because the latter technologies only supply electricity generation when the resource (e.g. wind or sun) is available, but they do not supply capacity that can be relied on to provide electricity. IER reported on one analysis that attempts to measure the “levelized avoided cost” of wind, for example. In this paper, the hidden costs of wind (e.g. the cost of back-up power) added to the levelized cost of wind totals 15.1 cents per kilowatt-hour if natural gas is used as the back-up power and 19.2 cents per kilowatt-hour if coal is used as the back-up power.
It is important that readers, especially policy makers, understand this aspect of non-dispatchable power. Since non-dispatchable power cannot be counted on to produce power when the consumer needs it, it is, in a sense, an unconventional electricity source. Because our electrical system must respond to consumer demand instantaneously, non-dispatchable power is in essence superfluous to our needs. The requirement that dispatchable power back-up non-dispatchable power to make sure electricity is there when needed is not a luxury, but a necessity. The more that non-dispatchable power is used, the more the electrical system requires investments in dispatchable generation forms to back up its increased use. Government policies that promote the use of non-dispatchable power are equivalent to requiring consumers to buy and care for two vehicles: one that works when you need it and another that works when it feels like it. The hidden costs of non-dispatchable power are substantial and should not be overlooked as part of the public policy discussion.
Source: Energy Information Administration, Annual Energy Outlook 2013,
http://www.eia.gov/forecasts/aeo/er/electricity_generation.cfm
[1] Energy Information Administration, NEMS documentation, http://www.eia.doe.gov/oiaf/aeo/overview/index.html
[2] Energy Information Administration, Annual Energy Outlook 2013, http://www.eia.doe.gov/oiaf/aeo/index.html
[3] Energy Information Administration, Annual Energy Outlook 2013, http://www.eia.gov/forecasts/aeo/er/electricity_generation.cfm
[4] Base load plants are facilities that operate almost continuously, generally at annual utilization rates of 70 percent or higher. Intermediate load plants are facilities that operate less frequently than base load plants, generally at annual utilization rates between 25 and 70 percent. Peaking plants are facilities that only run when the demand for electricity is very high, generally at annual utilization rates less than 25 percent.
