
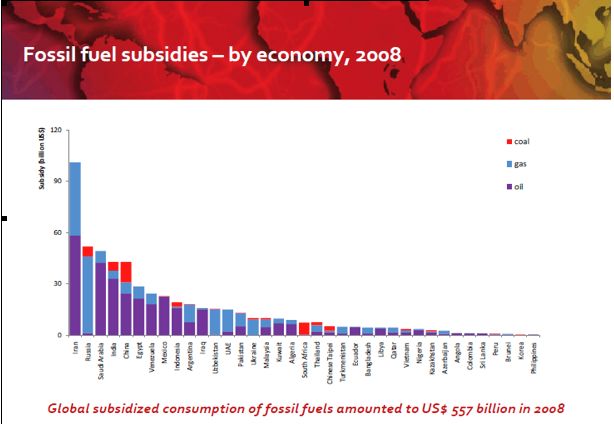
The International Energy Agency (IEA) of the Organization of Cooperation and Development (OECD) estimated subsidies for fossil fuels by country of origin and found that 37 countries represent 95 percent of total global fossil fuel subsidies used in final consumption and as input to the generating sector, but the United States is not one of those countries. That is, at least 37 countries have higher fossil fuel subsidies than we do. Those 37 countries are led by Iran and Russia. (See graph below.) Of the fossil fuels, oil had the highest level of subsidies estimated at $312 billion in 2008, natural gas was second at $204 billion, and coal was third at $40 billion, with the subsidies for the three fossil fuels totaling $557 billion.[i] For 2009, the IEA estimated fossil fuel consumption subsidies worldwide to be 44 percent lower at $312 billion, with the majority of those subsidies in non-OECD countries.[ii] The annual subsidy level varies due to different demand levels, international energy prices, domestic pricing and government policies.
While worldwide subsidies for renewable energy are not estimated to equal the level of fossil fuel subsidies, on a production basis, they far exceed those of fossil fuels. IEA estimated that subsidy support for renewable energy in 2009 totaled $57 billion, of which $37 billion was for renewable energy in the electric generating sector and the remainder was for biofuels.[iii] Putting fossil fuel and renewable subsidies on an output basis, however, results in subsidies for renewable energy to be over 6 times more than for fossil fuels.

The IEA Study
Generally, an energy subsidy is defined as “a direct cash payment by a government to an energy consumer or producer. The IEA has defined energy subsidies as any government action that concerns primarily the energy sector that lowers the cost of energy production, raises the price received by energy producers or lowers the price paid by energy consumers.”[iv] IEA admits that estimating subsidies is not simple. Because there is no systematic reporting of subsidies, the IEA uses a methodology called price-gap, which is the difference between a reference price and the retail price. The reference price is either based on the import parity price for net importing countries or the export parity price for net exporting countries based on the nearest international hub, and adjusted for quality differences, taxes, and freight fees.
Using this methodology, the IEA estimated that total global subsidies to consumers for the three fossil fuels in 2008 were $557 billion, which include subsidies to fossil fuels used in final consumption and to fossil fuels used as input to the electric generating sector.[v] (See graph below.) Other estimates for subsidies have been made. For example, the International Monetary fund estimated subsidies for petroleum products (gasoline, diesel, kerosene) at $500 billion in 2008 using the international spot price for each product at its peak price in mid-2008.

The price-gap methodology excludes subsidies that are provided directly to consumers without impacting the market price. An example in the United States is the Low-Income Home Energy Assistance Program (LIHEAP) provided to households to help pay their heating bills. Other subsidies of this nature are grants to farmers to help cover higher fuel prices or employers’ providing cars and fuel for transportation in lieu of higher salaries.[vi]
Another type of subsidy that has not been quantified across countries are tax expenditures such as reduced or zero tax rates, tax exemptions for “clean” fuels, automatic tax cuts if fuel costs escalate, accelerated depreciation, and tax cuts for depletion of fuels, to name a few.[vii]
Investment in research and development is another type of subsidy. IEA estimates that total government expenditures to research and development for fossil fuels in 2008 total $1.7 billion.[viii]
Renewable Subsidies
Subsidies for renewable fuels have accelerated recently due to interest in developing alternative forms of energy to fossil fuels. To support biofuels in the transportation sector, tax reductions and credits, along with regulations requiring minimum amounts of biofuels have been implemented by some countries. In 2006, it was estimated that these interventions were worth $10 billion in just the OECD countries and could increase to $15 billion by 2010. In the United States alone, it is estimated that the biofuels program could exceed $1 trillion over the next two decades if the targets the United States established are met.[ix]
Other renewable subsidies cover the generation sector for solar, wind and other non-fossil technologies that include tax credits, favorable tax accounting, feed-in tariffs, and research and development. A comparison for 2007 made by the Global Subsidies Institute of the International Institute for Sustainable Development breaks out preliminary subsidies by type as follows: fossil fuels to non-OECD consumers, $400 billion; nuclear energy, $45 billion; renewable energy for electricity generation excluding hydroelectric power, $27 billion; and biofuels, $20 billion. The biofuels analysis was done for 8 countries and regions: Australia, Canada, China, the European Union, Indonesia, Malaysia, Switzerland, and the United States.[x]
On a per unit of production basis, however, renewables had the largest subsidies with biofuels the highest at 5.1 cents per kilowatt hour, renewable energy for electricity generation at 5.0 cents per kilowatt-hour, nuclear energy at 1.7 cents per kilowatt hour, and fossil fuels at 0.8 cents per kilowatt hour.[xi] (See graph below.)The biofuels number is lower than actual because the calculation is based on taking the subsidies for the 8 countries and dividing by the total global biofuels production, rather than the biofuels production for just the 8 countries.

Source: Global Studies Institute, Relative Subsidies to Energy Sources: GSI Estimates, April 19, 2010, http://www.globalsubsidies.org/files/assets/relative_energy_subsidies.pdf
Taxes versus Subsidies for Oil Products
Almost all OECD countries levy taxes on fossil fuels (oil, coal, and natural gas), and electricity. In non-OECD countries, the sale of non-oil forms of energy is less often taxed and the rates are generally lower. In OECD countries, taxes far exceed the subsidies for energy. In the seven OECD countries in the graph below, revenues from special duties and taxes, not including value added taxes, on the sale of oil products totaled $223 billion in 2003. That value was at least 7 times larger than the energy subsidies for the entire OECD in 2003. Taxes were the highest in Germany at almost $50 billion. The United States ranked fourth out of the 7 countries, with taxes on oil products amounting to almost $35 billion in 2003.[xii]

Impact of Phasing Out Subsidies on Greenhouse Gas Emissions
Based on IEA’s modeling analysis, phasing out consumption-based fossil fuel subsidies totally between 2011 and 2020, would result in global primary energy demand being 5.0 percent lower in 2020 and global carbon dioxide emissions being 5.8 percent lower by 2020.[xiii] By 2050, global carbon dioxide emissions would be 11 percent lower, and global emissions of other greenhouse gases would be 7 percent lower.[xiv] The United States, however, would see almost no improvement in total greenhouse gas emissions, an increase in carbon dioxide emissions, and a decrease in other greenhouse gas emissions. See graph below.

Conclusion
Subsidies and taxes on energy differ around the globe and vary year-to-year based on fluctuations in the international price of energy, domestic pricing policies, and demand levels. In OECD countries, taxes on oil products far exceed the subsidies on those products. Most subsidies on fossil fuels are in non-OECD countries. On a unit of production basis, subsidies for both renewable energy for electricity and biofuels far exceed those for fossil fuels and nuclear power. Phasing out subsidies for fossil fuels by 2020 is estimated to result in lower greenhouse gas emissions globally, but the total reduction by 2050 is less than 10 percent.
[i] International Energy Agency, Global fossil fuel subsidies and the impacts of their removal, http://www.worldenergyoutlook.org/docs/energy_subsidies_slides.pdf
[ii] International Energy Agency, World Energy Outlook 2010 Executive Summary, November 2010, http://www.worldenergyoutlook.org/docs/weo2010/WEO2010_ES_English.pdf
[iii] Ibid.
[iv] International Energy Agency, Carrots and Sticks: Taxing and Subsidizing Energy, http://www.iea.org/papers/2006/oil_subsidies.pdf
[v] International Energy Agency, Analysis of the Scope of Energy Subsidies and Suggestions for the G-20 Initiative, June 16, 2010, http://www.worldenergyoutlook.org/docs/G20_Subsidy_Joint_Report.pdf
[vi] Ibid.
[vii] Ibid.
[viii] Ibid.
[ix] International Energy Agency, Analysis of the Scope of Energy Subsidies and Suggestions for the G-20 Initiative, June 16, 2010, http://www.worldenergyoutlook.org/docs/G20_Subsidy_Joint_Report.pdf
[x] Global Studies Institute, Relative Subsidies to Energy Sources: GSI Estimates, April 19, 2010, http://www.globalsubsidies.org/files/assets/relative_energy_subsidies.pdf
[xi] Global Studies Institute, Relative Subsidies to Energy Sources: GSI Estimates, April 19, 2010, http://www.globalsubsidies.org/files/assets/relative_energy_subsidies.pdf
[xii] International Energy Agency, Carrots and Sticks: Taxing and Subsidizing Energy, http://www.iea.org/papers/2006/oil_subsidies.pdf
[xiii] International Energy Agency, World Energy Outlook 2010 Executive Summary, November 2010, http://www.worldenergyoutlook.org/docs/weo2010/WEO2010_ES_English.pdf
[xiv] International Energy Agency, Analysis of the Scope of Energy Subsidies and Suggestions for the G-20 Initiative, June 16, 2010, http://www.worldenergyoutlook.org/docs/G20_Subsidy_Joint_Report.pdf
