
In last Sunday’s New York Times Dialogue on Incentives on Energy, Denise Bode, Chief Executive of the American Wind Energy Association, argued that
- “Including incentives, which all forms of energy get, wind is now close to cost-competitive with all other energy sources”, and
- “Over all wind power supports 75,000 jobs across the United States today, and —with a stable tax policy—it promises to support 500,000 American jobs less than 20 years from now.”
Sadly, these statements are more wishful thinking from the wind industry.
The Feasibility of 20 Percent Wind by 2030
Ms. Bode’s latter statement is presumably based on a Department of Energy study that evaluated a scenario where wind is assumed to supply 20 percent of generation by 2030. The question, of course, is whether that target is likely to be met. According to the Energy Information Administration (EIA) (also part of the Department of Energy) and the International Energy Agency (IEA), a 20 percent wind scenario in 2030 is highly unlikely unless directly mandated by government fiat. Even policies such as a Clean Energy Standard or a Renewable Energy Standard do not reach a 20 percent share for wind generation, according to the EIA.
In EIA’s Annual Energy Outlook 2011, wind’s generation in 2030 is projected to be 159 billion kilowatt hours, about 70 percent higher than wind generation in 2010, but still a mere 3.2 percent share of generation. In EIA’s recent analysis evaluating an 80 percent clean energy standard by 2050, wind generation nearly doubles from the agency’s prediction in the Annual Energy Outlook by 2035. But an almost doubling in wind generation only provides a 6.3 percent share. EIA’s analysis of a 25 percent renewable energy standard also does not make the wind target in the DOE report cited by Ms. Bode. In that case, wind receives only a 4.9 percent share in 2030.
The question, of course, is if wind is almost cost competitive with all other energy sources and if there are policies that demand clean energy or renewable generation at levels of 25 percent or higher, why doesn’t wind generation penetrate further? The reason is that wind is an intermittent technology that is literally at the mercy of the wind. If the wind doesn’t blow, there is no generation from wind power, and thus a back-up technology needs to be ready to be brought on line at a moment’s notice. For this reason, Britain is contemplating adding a capacity value surcharge to wind that would pay for the back-up power from fossil fuels when it is needed.
So in the case of a clean energy standard, the big winners are natural gas (even though the standard penalizes it for its emissions), nuclear, and biomass generation, all of which can be used as base load power that provides generation on a continuous basis. In the case of the renewable energy standard, the principle winner, according to EIA analyses, is biomass gasification because it is a base-load generation technology and can be relied on when needed.
Further, Ms. Bode does not mention that once the better wind resources are used up, the cost of wind power increases because the sites are more difficult to build on; they are further away from existing transmission lines, requiring additional transmission lines to reach the major electricity markets; or the wind doesn’t blow as much and thus a lower level of generation is obtained from the same capacity as the wind generators on the better sites. These issues make wind less cost competitive among other technologies. (See the wind resource chart below.)
And, a scenario requiring 20 percent wind generation by 2030, if it were feasible, would require more than 300 gigawatts of wind capacity (or about 13,000 megawatts of new wind capacity each year) and that capacity would require huge land requirements. The Roscoe Wind Complex in Texas, one of the world’s largest wind projects, has a capacity of 781.5 megawatts and covers about 154 square miles—about 0.2 square miles per installed megawatt of wind capacity. Using this example, 300,000 megawatts of capacity would require about 60,000 square miles of land for wind turbines, larger than the land mass of Florida.

This growth in wind turbine capacity would require siting wind units on publicly owned lands where a large percentage of the development sites are located, continued taxpayer-funded subsidies, the building of power lines to remote areas where wind turbines are located, and the public acceptance of noise and other wind-related effects. And, that wind capacity would need to be backed-up with reliable fossil fuel capacity, adding additional cost and reducing the carbon dioxide benefits of introducing this level of wind energy.
The DOE analysis is also predicated on the assumption of very high capacity factors for wind of more than 40 percent. The experience of wind in Texas, the state with the most wind power capacity, finds that the output of the wind turbines can range from zero to 49 percent of installed capacity. However, at peak load (from 4 pm to 6 pm in July and August), the average output of the wind turbines in the Electric Reliability Council of Texas (ERCOT) was 16.8 percent of capacity. Wind energy does not provide much capacity value when most needed because winds are best in the late evening and early morning hours when demand is lower. Based on a stochastic analysis of the effective load carrying capability of wind in ERCOT, the reliability council uses 8.7 percent of installed wind capacity in its reserve margin calculation.
Subsidies among Energy Sources
While all forms of energy get some sort of incentives as Ms. Bode indicates, some get more than others and that is also true of renewable energy technologies. Another recent study by the EIA evaluated energy subsidies for fiscal year 2010. EIA found that renewable energy subsidies were higher than any other fuel at $14.7 billion dollars in fiscal year 2010, led by biofuels ($6.6 billion) and wind ($5 billion). Fossil fuels and nuclear received subsidies of less than $3 billion: coal received $1.4 billion, oil and natural gas together received $2.8 billion, and nuclear received $2.5 billion.
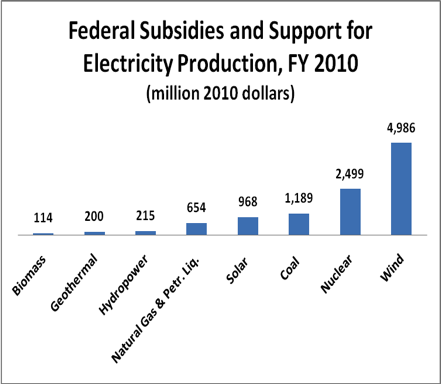
Evaluating just the electricity subsidies, wind received more than 7 times the amount of subsidies oil and natural gas received for electricity generation, and more than 4 times the amount of subsidies that coal received. (See chart below.) The disparity gets even larger when evaluated on a unit of production basis. Wind was subsidized over 80 times more than the subsidies for conventional fossil fuels based on a megawatt hour of generation. Wind received $56 per megawatt hour compared to $0.64 per megawatt hour each for coal, and oil and natural gas combined.
Source: Energy Information Administration, Direct Federal Financial Interventions and Subsidies in Energy in Fiscal Year 2010, July 2011, http://www.eia.gov/analysis/requests/subsidy/pdf/subsidy.pdf

*Natural Gas and Petroleum Liquids
Source: Calculated from Energy Information Administration, Direct Federal Financial Interventions and Subsidies in Energy in Fiscal Year 2010, July 2011, http://www.eia.gov/analysis/requests/subsidy/pdf/subsidy.pdf
The Cost of Generating Electricity among Various Technologies
Another way to compare technologies is on a levelized cost of generation basis. Levelized costs represent the present value of the total cost of building and operating a generating plant over its financial life, converted to equal annual payments and amortized over expected annual generation. In EIA’s Annual Energy Outlook reference case, a 3-percentage point increase in the cost of capital is added when evaluating investments in greenhouse gas intensive technologies such as coal-fired power plants without carbon capture and sequestration (CCS) technology and coal-to-liquids plants. The 3-percentage point adjustment is similar to a $15 per ton carbon dioxide emissions fee when investing in a new coal plant without CCS technology. This adjustment represents the implicit hurdle being added to greenhouse gas intensive projects to account for the possibility that they may need to purchase allowances or invest in other greenhouse gas emission-reducing projects that offset their emissions in the future. Thus, the levelized capital costs of coal-fired plants without CCS are likely higher than most current coal project costs.
Realizing that coal is being penalized as part of the assumptions of the analysis, one can compare wind’s levelized cost to that of other technologies. As you can see, onshore wind is more expensive than natural gas-fired technologies, and close to the cost of conventional coal technologies with their higher cost of financing. Applying a 2 cent per kilowatt hour production tax credit to wind’s generation cost still does not make it cost competitive among natural-gas fired technologies. And, offshore wind has the second highest cost of production after solar thermal, which is the reason why the Cape Wind Project off the coast of Cape Cod, Massachusetts is having difficulty finding buyers for its wind power. (See chart below.)

Current Wind Industry Jobs
According to the Congressional Research Service (CRS), the number of wind manufacturing jobs has remained relatively flat over the past 3 years at an estimated 20,000 jobs. (See chart below.) The majority of the 75,000 jobs (60 percent) that Ms. Bode quotes are in finance and consulting services, contracting and engineering services, and transportation and logistics. Only 3,500 jobs were in construction and 4,000 in operations and maintenance in 2010.
Wind turbine manufacturing is responsible for a very small share (less than 1 percent) of the total manufacturing jobs (11.5 million) in the United States in 2010. According to the DOE report that evaluated the 20 percent wind energy in 2030, turbine assembly and component plants would supply about 32,000 manufacturing jobs in 2026. But the American Wind Energy Association’s assessment is that the number would be 3 to 4 times that amount under a long-term stable policy environment. As CRS notes, the real number will be dependent not only on the demand for wind, but also on corporate decisions of where to produce the needed components. Those decisions could very well result in manufacturing jobs outside of the United States. As CRS notes, imports of wind generating equipment increased from $482.5 million in 2005 to $2.5 billion in 2008, held at $2.3 billion in 2009 and decreased to $1.2 billion in 2010 due to lower relative demand for new wind energy, declining prices, and new manufacturing plants in the United States. While European suppliers were the leaders in wind equipment imports to the United States, South Korea and China are now becoming players in the U.S. market.

Conclusion
When all the facts are on the table, wind is not the panacea that Ms. Bode implies from her statistics. All technologies have their limitations and so does wind. We need to recognize the issues associated with each technology and use them according to their strengths without the American consumer and tax payer paying exorbitant fees for the power that they do produce.
