
WASHINGTON D.C. — IER Director of Regulatory and State Affairs Daniel Simmons will testify at 11:00AM ET today before the Ohio Senate Public Utilities Committee. In his role at IER, Simmons oversees energy research and outreach at the state level. His testimony will focus on the misperceptions of the Renewable Portfolio Standards (RPSs) as they relate to the state of Ohio. The testimony is as follows:
Introduction
Support for Renewable Portfolio Standards (RPSs), also known as renewable electricity mandates, are based in large measure on misperceptions. Common misperceptions regarding these mandates include:
- RPSs are needed because America is running out of coal, oil, and natural gas
- RPSs are needed because renewables are infant technologies and need help
- RPSs will reduce the cost of electricity
- RPSs will create jobs
- RPS are an effective way to reduce carbon dioxide emissions
None of these are true, but what is true is that RPSs raise the cost of energy and the states that have RPSs tend to have the most expensive electricity. This hurts people and the businesses that will have to compete with even higher-priced inputs. If you are looking for a competitive edge, this isn’t it. In fact, these renewable energy mandates are leftover from the days when it was widely thought the U.S. was running out of energy. Those days are over.
America is energy rich, not energy poor
One of the most popular misconceptions about RPSs is that they are necessary because we are running out of energy resources and should therefore use more renewable resources. The reality is far different. The United States is not just energy rich, but according to the Congressional Research Service, the United States has the largest combined coal, oil, and natural gas resources in the world.[1]
For electricity production, coal and natural gas are the most important resources and the United States has a large amount of coal and natural gas. In fact, the United States has 486.1 billion short tons of coal in its Demonstrated Reserve Base.[2] The U.S. consumes 1 billion short tons of coal a year.[3] That is over 480 years of coal at our current rate of consumption. This may be an understatement of America’s coal resources because it does not include all of Alaska’s coal resources and some estimates are that Alaska has more coal than the entire lower 48 combined.
The United States also has large amounts of natural gas. We have about 2.744 quadrillion cubic feet of technically recoverable natural gas.[4] The U.S. uses 24 billion cubic feet a year so we have enough natural gas for more than a century at the current rate of use, and if you find more here in Ohio, that number will grow significantly.
Renewables like wind and solar are not new, infant technologies
One argument for renewable electricity mandates is that some people believe that renewables are the future and therefore we should mandate their use today to have future energy quicker. This argument presupposes that technologies like wind and solar are infant technologies and only need a leg up to be cost competitive.
But wind and solar are far older technologies than most people realize. In fact, people have used wind power to generate electricity for more than 125 years since a Scottish academic named James Blyth made a wind turbine.[5]
Solar is also not an infant technology. The first solar cells were made in 1883 by American inventor Charles Fritts.[6] The first photovoltaic cells powerful enough to run everyday electrical equipment were created in 1954.[7]
For decades the promoters of wind and solar have been claiming that wind and solar will soon be cost competitive—if only they receive some subsidies (or mandates…or both!) to help out. For example, in 1983, Booz, Allen & Hamilton did a study for the Solar Energy Industries Association, American Wind Energy Association, and Renewable Energy Institute. The report stated that “The private sector can be expected to develop improved solar and wind technologies which will begin to become competitive and self-supporting on a national level by the end of the decade [i.e. by 1990] if assisted by tax credits and augmented by federally sponsored R&D.”[8] In 1986, Amory Lovins of the Rocky Mountain Institute lamented the untimely scale-back of tax breaks for renewable energy, since the competitive viability of wind and solar technologies was “one to three years away.”[9]
Despites years or subsidies for wind, solar, and other renewables, these technologies are still not competitive with coal, natural gas, and other affordable, reliable sources of electricity generation. After all, if these renewables were cost-competitive, there would be no need for RPSs or subsidies like the wind Production Tax Credit (PTC).
The reality is that we do not know what the future will bring for electricity generation. But we should not presume to know what will be cost-competitive in the future. Instead of presupposing that it will be wind and solar, these technologies should prove themselves in the market. Henry Ford didn’t get a market guarantee or a mandate. People bought his cars because they were cheap and dependable. The same goes for all things that make it in the market.
Renewables are expensive
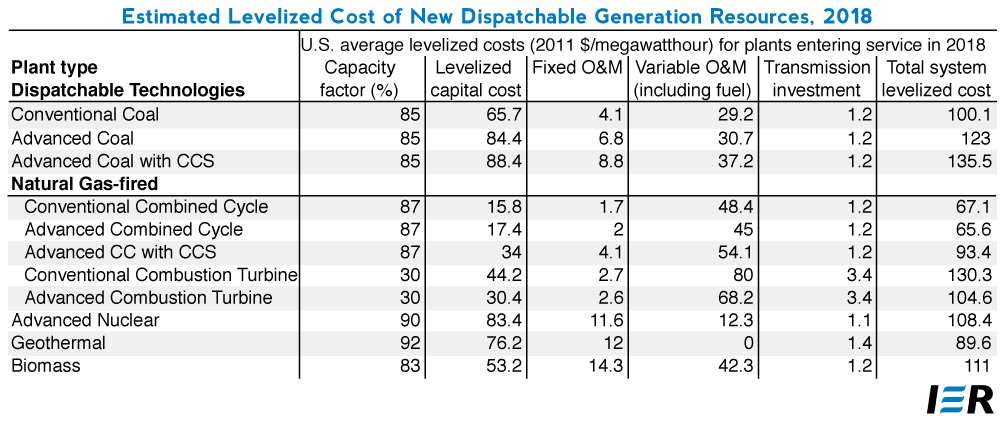
There are several ways to look at the cost of producing electricity. One way is to look at the cost of building and operating new electricity-generation facilities. EIA forecasts energy supply and demand, and their forecast includes estimates of:
- The cost of electricity that includes the capital cost.
- The cost of operating and maintaining the facilities (including fuel).
- The cost of the transmission to get the electricity to market.
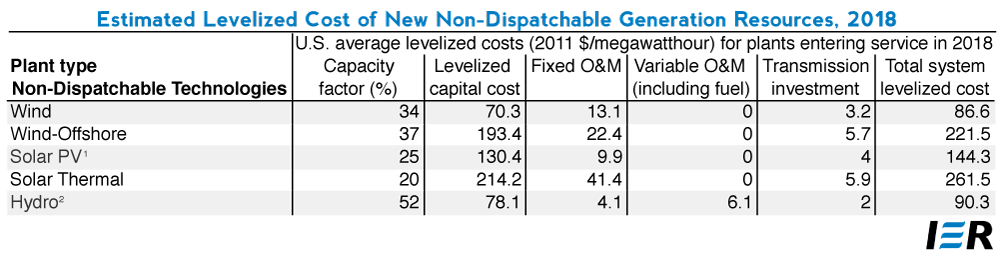
EIA estimates these data for 2018, the most recent year that technologies can be compared due to the lead time for construction. The least expensive form of new electricity generation is expected to be natural gas, followed by wind.[10] Solar is more than three times more expensive in EIA’s calculation than natural gas. Also, it should be noted that coal’s price is artificially high because EIA included a penalty of three percentage points on the cost of capital to represent the difficulty of obtaining financing for new coal units. This is equivalent to a $15 per ton carbon tax, or about 4 times as high as Europe’s carbon trading price. The price for new coal plants would drop considerably if they did not include this additional cost.
It appears that wind is, therefore, pretty inexpensive. The problem with this assumption is that it does not consider the requirements of the electrical grid. Wind, according to EIA might be inexpensive, but it is only inexpensive when the wind is actually blowing and the wind does not blow all the time (and for that matter, the sun does not always shine). To see this graphically, here this chart from California ISO, the California grid operator, shows actual renewable production in California on March 18, 2013:
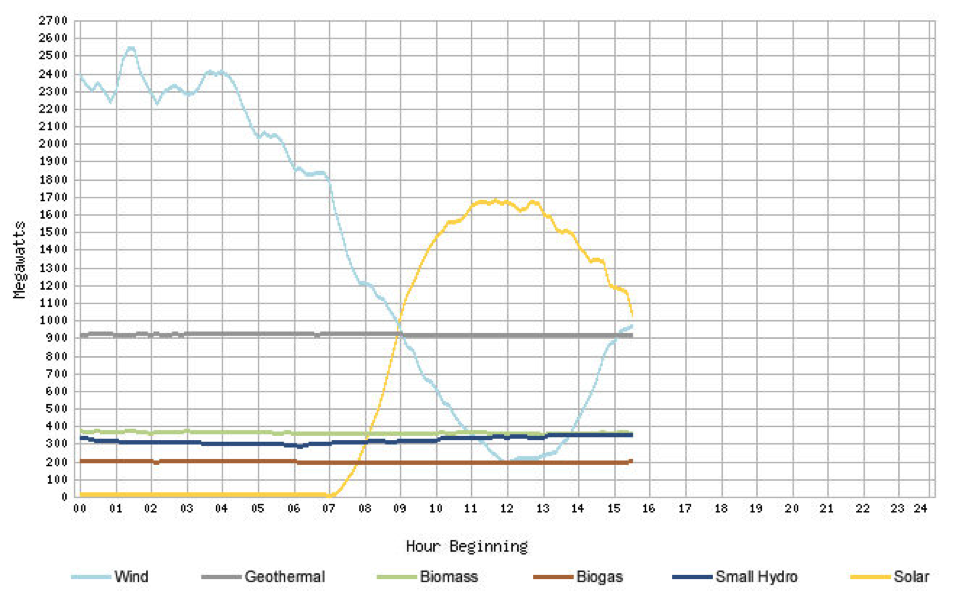
Wind produced a high of 2,500 megawatts at 1:30 am and then production fell to 200 megawatts by noon. This amount of variability in production is normal, however, to keep the lights on, the electrical grid needs to match electricity demand with electricity supply at all times. That means that wind power needs backup to generate electricity as wind power varies throughout the day. This increase the true cost of wind power.
The American Tradition Institute recently produced a study to look at the true cost of wind power. Their study added the hidden costs of wind which included the cost of fossil fuel power as back-up when the wind is dormant, the additional cost of transmission that frequently occurs with wind farms due to the inaccessibility of the best wind resources, the cost of wind’s favorable tax benefits in “accelerated depreciation,” and a shorter estimated life of a wind turbine of 20 years to the per-kilowatt-hour cost of generating electricity from wind power that includes capital costs and operating costs, as determined by EIA and the Department of Energy. They found the cost of wind power to be 15.1 cents per kilowatt hour if natural gas is used to back-up the wind energy or 19.2 cents per kilowatt hour if coal is used as the back-up fuel.[11] These costs are 1.5 to 2 times the 9.6 cents per kilowatt hour estimate the EIA is using for generating electricity from wind in its models.[12]
Lastly, another and more important way to look at the cost of sources of generation is to look at the states with the least expensive electricity rates and see how they generate their electricity. The following chart shows the 10 states with the least expensive electricity rates and their largest sources of electricity generation.[13] Note that coal produces the large share of electricity in seven out of 10 states and hydroelectric produces the largest share in the other three:
[table id=58 /]
The takeaway from this chart is that according to EIA, although natural gas might be the least expensive source of electricity generation if you are building new plants, where coal plants are already built and where hydroelectric dams exist, coal and hydroelectric power is the cheapest. That also means that if older plants of any kind are being replaced, the cost of electricity from new plants will likely be more expensive. Building new plants will almost be more expensive than using older plants that are paid for.
Renewable mandates and subsidies do not create jobs on net
One argument people use to promote renewable electricity mandates is that the mandates can create “green” jobs. But trying to create jobs through renewable subsidies has proved to be a failure. In Spain, for example, it is estimated that 2.2 jobs were lost as an opportunity cost of creating one expensive, subsidy- and set-aside-dependent job in the renewable sector.[14] Unemployment there is now over 25 percent, even though the government spent huge amounts on green energy. In Germany, per worker subsidies in the solar industry are as high as $240,000 per worker.[15] The situation in Denmark is similar. Danes have to pay the highest electricity prices in the European Union, and they pay subsidies of nearly $400 million a year to wind producers (in a country with less than 2 percent of the population of the United States).[16] Throughout Europe, countries are backing away as fast as possible from subsidies and mandates because the electricity prices are driving businesses to other countries and they can’t afford it.
Unfortunately in the United States, our track record isn’t better than Europe’s. At the end of last year, the federal wind production tax credit was extended for another year. According to the Joint Tax Committee, this one-year extension of the PTC would cost $12.1 billion.[17] The American Wind Industry Association, the lobby for the wind industry, claims that 37,000 jobs would have been lost if the PTC was not extended. This means that each job “saved” cost the U.S. Treasury $327,000.
While the PTC and other subsidies, such as RPSs might “create” some identifiable jobs, they do not create jobs “on net.” The money to pay for the subsidies, like the PTC, has to come from somewhere. In other words, if taxpayer had been able to keep the money instead of it going to subsidies, the taxpayers would have spent the money and they spending would have created jobs.
Because RPSs require the use of more expensive electricity, they do not create jobs on net. Currently, states that have renewable mandates have residential electricity prices 27 percent higher than states without these mandates. While the renewable mandates may not be the only reason electricity prices are higher in those States, these mandates likely contribute to higher prices and certainly are not helping to decrease the price. After all, renewable electricity mandates require the generation of electricity from more expensive sources. Typically, too, they require backup generation, as well as backup capacity, and they typically place stress on transmission-grid operations (owing to their stochastic nature). As states increase their use of renewable sources, it is therefore likely that the price of electricity in states with mandates will increase even more. California is bleeding jobs to other states in part because of their green energy policies that harm manufacturers. Do Ohio’s agricultural industries need to pay more for electricity? Would that be a good thing?
Renewable Electricity Mandates Are an Expensive Way to Reduce Carbon Dioxide Emissions
Some argue that renewable electricity mandates are a good way to reduce carbon dioxide emissions,[18] but renewable electricity mandates are a very expensive way to reduce carbon dioxide emissions. According to the California Air Resources Board, it costs $133 per ton to reduce carbon emissions through a renewable electricity mandate.[19] An internal Obama administration memorandum on subsidies for renewables recently noted that carbon dioxide emissions “would have to be valued at nearly $130 per ton for CO2 for the climate benefits to equal the subsidies.”[20] To put these numbers in perspective, it currently costs about $3.60 a ton to purchase a certified carbon dioxide allowance traded on the European Climate Exchange.[21]
Air Pollution and Coal
America and Ohio are very rich in coal. On reason some support RPSs is because they are concerned about air pollution from coal. But there is good news—our air quality is improving and new coal plants are cleaner than ever before.
Today’s coal-fired electricity-generating plants produce more power, with less emission of pollutants, than ever before. The reason is because of pollution control technologies such as flue gas desulfurization, selective catalytic reducers, fabric filters, and dry sorbent injection, all of which have greatly reduced coal plant emissions. Coal plants can be built today with much lower emissions than in the past. For example, according to the National Energy Technology Laboratory (NETL), a new pulverized-coal plant (operating at lower, “subcritical” temperatures and pressures) reduces the emission of NOx (nitrogen oxides) by 86 percent, SO2 (sulfur dioxide) by 98 percent, and particulate matter by 99.8 percent, as compared with a similar plant having no pollution controls.[22]
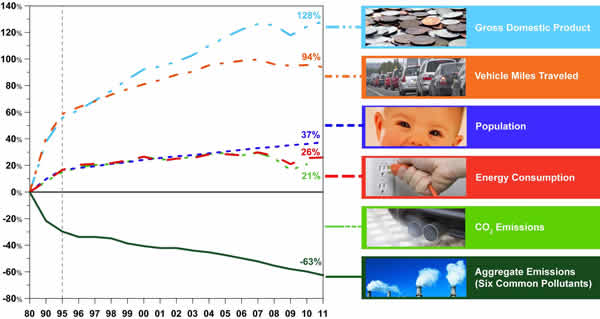
These advances in technology have enabled large improvements in air quality. Since 1970, the total emissions of the six criteria pollutants have declined by 68 percent, even though energy consumption has increased by 45 percent, vehicle miles traveled have increased by 167 percent, and the economy has grown by 212 percent.[23] (The “criteria pollutants” are carbon monoxide, lead, sulfur dioxide, nitrogen oxides, ground-level ozone, and particulate matter.) The following chart from EPA shows the increase in economic measures compared to the decrease in pollution emissions.[24]
As technology continues to advance, coal-fired power plants will become even cleaner and air quality will continue to improve.
Conclusion
Much of the support for renewable portfolio standards is based on misperceptions about America’s energy resources and the nature of electricity generation. America is an energy rich country and we are especially rich in coal. We have enough coal to last for literally hundreds of years along with more than 100 years of natural gas resources. There are some concerns about air quality, but history shows that even as we have use more energy, our air quality has improved.
Mandating renewables will only increase the cost of electricity and create a further drag on an already struggling economy. Electricity supply needs to equal electricity demand or the electrical grid will fail. But intermittent sources like wind and solar cannot be counted on to produce electricity at the correct time to keep the lights on.
Someday battery technologies may improve and wind and solar technologies may be cost-competitive with affordable, reliable sources like coal and natural gas. But wind and solar are not cost-competitive yet and we should let the technologies improve instead of mandate their use and pay the price with higher electricity rates.
[1] Gene Whitney et. al., U.S. Fossil Fuel Resources: Terminology, Reporting, and Summary, Congressional Research Service, Nov. 30, 2010, http://epw.senate.gov/public/index.cfm?FuseAction=Files.view&FileStore_id=04212e22-c1b3-41f2-b0ba-0da5eaead952.
[2] Energy Information Administration, Annual Coal Report 2009, Table 15: Recoverable Coal Reserves at Producing Mines, Estimated Recoverable Reserves, and Demonstrated Reserve Base by Mining Method, 2009,
http://www.eia.gov/cneaf/coal/page/acr/table15.pdf.
[3] Energy Information Administration, International Energy Statistics: Coal—Consumption, http://www.eia.gov/cfapps/ipdbproject/IEDIndex3.cfm?tid=1&pid=1&aid=2.
[4] Energy Information Administration, Assumptions to the Annual Energy Outlook 2011, April 2011, http://www.eia.gov/oiaf/aeo/assumption/oil_gas.html; Energy Information Administration, Review of
Emerging Resources: U.S. Shale Gas and Shale Oil Plays, July 2011, http://www.eia.gov/analysis/studies/usshalegas/pdf/usshaleplays.pdf; USGS, USGS Releases New Assessment
of Gas Resources in the Marcellus Shale, Appalachian Basin, Aug. 23, 2011,
http://www.usgs.gov/newsroom/article.asp?ID=2893&from=rss_home.
[5] The Courier, Renewable energy and role of Marykirk’s James Blyth, July, 16, 2010, http://web.archive.org/web/20120314025335/http://www.thecourier.co.uk/Community/Heritage-and-History/article/2332/renewable-energy-and-role-of-marykirk-s-james-blyth.html.
[6] Department of Energy, The History of Solar, http://www1.eere.energy.gov/solar/pdfs/solar_timeline.pdf.
[7] Id.
[8] Renewable Energy Industry, Joint Hearing before the Subcommittees of the Committee on Energy and Commerce et al., House of Representatives, 98th Cong., 1st sess. (Washington, D.C.: Government Printing Office, 1983), p. 52.
[9] Lovins, in K. Wells, “As a National Goal, Renewable Energy Has An Uncertain Future.” Wall Street Journal, February 13, 1986, pp. 1, 19 at 19.
[10] For more information, see this explanation of EIA’s calculations, see Institute for Energy Research, Levelized Cost of new Electricity Generating Technologies, Feb. 1, 2011, https://www.instituteforenergyresearch.org/levelized-costs-of-new-electricity-generating-technologies/. For example, EIA’s annualized cost figure for generating electricity from new coal includes a penalty of three percentage points on the cost of capital to represent the difficulty of obtaining financing for new coal units.
[11] George Taylor & Thomas Tanton, The Hidden Costs of Wind Electricity Why the full cost of wind generation is unlikely to match the cost of natural gas, coal or nuclear generation, http://www.atinstitute.org/wp-content/uploads/2012/12/Hidden-Cost.pdf.
[12] Energy Information Administration, Levelized Cost of New Generation Resources in the Annual Energy Outlook 2012, July 12, 2012, http://www.eia.gov/forecasts/aeo/electricity_generation.cfm
[13] See Energy Information Administration, Electric Power Monthly, Table 5.6.A. Average Retail Price of Electricity to Ultimate Customers by End-Use Sector, http://www.eia.gov/electricity/monthly/epm_table_grapher.cfm?t=epmt_5_06_a.
[14] Gabriel Calzada Álvarez, Study of the Effects on Employment of Public Aid to Renewable Energy Sources, Mar. 2009, http://www.juandemariana.org/pdf/090327-employment-public-aid-renewable.pdf.
[15] Manuel Frondel, Nolan Ritter, & Colin Vance, Economic impacts from the promotion of renewable energies: The German experience, Oct. 2009, https://www.instituteforenergyresearch.org/germany/Germany_Study_-_FINAL.pdf
[16] Hugh Sharman & Henrik Meyer, Wind Energy: The Case of Denmark, Sept. 2009, http://www.cepos.dk/fileadmin/user_upload/Arkiv/PDF/Wind_energy_-_the_case_of_Denmark.pdf.
[17] Joint Committee on Taxation, JCX-70-12, Aug. 2, 2012, http://www.finance.senate.gov/imo/media/doc/JCX.pdf.
[18] See, e.g. Kara Rowland, Chilly wind blows against global climate pact, Washington Times, Nov. 7, 2010, http://www.washingtontimes.com/news/2010/nov/7/after-vote-obama-faces-chilly-road-on-climate (see Robert Gibbs comment).
[19] California Air Resources Board, Climate Change Scoping Plan, p. 84, http://climatechange.ca.gov/eaac/documents/state_reports/Adopted_Scoping_Plan.pdf.
[20] Stephen Power, U.S. Weighs Funding for Renewable Energy Projects, Wall Street Journal, Nov. 3, 2010, http://online.wsj.com/article/SB10001424052748703506904575592843603174132.html.
[21] Point Carbon, EU CO2 prices to hit 2-3 euros without support: analyst, http://www.pointcarbon.com/news/1.2211004.
[22] Email from J. Kukielka, NETL to Mary Hutzler, Institute for Energy Research, Jan. 9, 2009. See also Institute for Energy Research, The Facts About Air Quality and Coal-Fired Power Plants, https://www.instituteforenergyresearch.org/2009/06/01/the-facts-about-air-quality-and-coal-fired-power-plants/.
[23] Environmental Protection Agency, Air Quality Trends, Jan. 5, 2012, http://www.epa.gov/airtrends/aqtrends.html.
[24] Environmental Protection Agency, Air Quality Trends, http://www.epa.gov/airtrends/aqtrends.html. The specific graphic is available here: http://www.epa.gov/airtrends/images/comparison70.jpg
