
“After years of talk about reducing our dependence on foreign oil, we are actually poised to control our own energy future,” Mr. Obama said. …“That’s a big deal. That’s a tremendous step towards American energy independence,” he said.
The Energy Information Administration announced recently that in October, the United States produced more oil than it imported for the first time since February 1995,[i] due to increasing shale oil production and fairly level petroleum demand. According to the Washington Post, the White House took credit for the milestone issuing a statement that it was “a result of both increased production and Administration policies like increased fuel economy standards that cut oil consumption, cut carbon pollution, and cut consumer bills.”[ii] Administration officials also “credited the president with promoting drilling on federal lands and offshore as part of his strategy to encourage more U.S. energy production.”[iii] According to Energy Guardian, “President Barack Obama used his weekly radio address to argue that his green energy policies helped domestic oil production outpace imports last month for the first time since 1995.”[iv] Unfortunately, Obama Administration policies did just the opposite than what the Administration is touting for oil production on federal lands has declined by 18 percent between fiscal year 2010 and 2012, while over the same time period, oil production on private and state lands, where there is far less red tape, has increased by 14 percent. [v] U.S. oil production is increasing, but it is in spite of President Obama, not because of him.
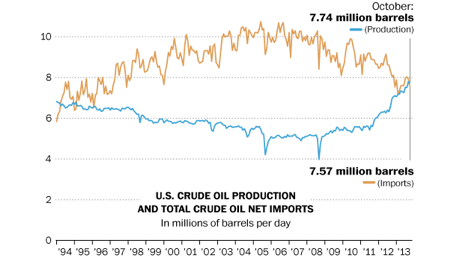
Source: Washington Post, http://www.washingtonpost.com/business/economy/us-oil-production-surpasses-imports/2013/11/13/ee03fd60-4cce-11e3-ac54-aa84301ced81_graphic.html
Oil Production and Import Data
For the first time since February 1995, net crude oil imports were less than domestic oil production. U.S. crude oil production totaled 7.74 million barrels a day in October, while net crude oil imports totaled 7.57 million barrels per day, 2.2 percent less. Oil production in October 2013 was 17 percent higher than in October 2012 and was the highest level of any month since May 1989. Net crude oil imports in October 2013 were 8 percent lower than in October 2012.[vi] And, analysts believe this trend of increasing oil production and decreasing oil imports will continue.
Oil production growth on private and state lands, particularly at shale formations in Texas and North Dakota, the top two oil producing states, is the major reason for the shift in production and import trends. Helping achieve the shift is a fairly level demand for petroleum products that has resulted from the recession and high oil prices, with many young workers opting for public transportation rather than owning vehicles.
Federal vs. Non-Federal Production
The rise in oil production is not due to federal policy. In fact, federal policy that transpired after the Deepwater Horizon accident in the Gulf of Mexico in 2010 resulted in a 23 percent decline in offshore oil production in federal waters between fiscal years 2010 and 2013. According to the Congressional Research Service, between fiscal years 2010 and 2012, oil production on federal lands both offshore and onshore fell from 1.989 million barrels per day to 1.627 million barrels per day, a drop of 18 percent. That was a 10 percentage point drop in share for production on federal lands, from a 36.5 percent share in fiscal year 2010 to a 26 percent share in fiscal year 2012. At the same time, oil production on private and state lands increased from 5.443 million barrels per day to 6.208 million barrels a day, an increase of 14 percent. Compared to private and state lands, production on federal lands is bogged down by red tape, regulatory uncertainties and restricted access to energy resources.
U.S. Shale Formations
According to the Energy Information Administration, there are 24 billion barrels of technically recoverable shale oil resources onshore in the lower 48 states. [vii] But this number can be viewed as being very conservative for the EIA is tasked to use government data where available. For example, in 1995, the U.S. Geological Survey estimated that the Bakken shale formation in North Dakota and eastern Montana held 151 million barrels of recoverable oil. But, in 2008, the USGS revised its estimate by a factor of 25, estimating that the Bakken holds 4.3 billion barrels—a resource figure the EIA uses in its reports and models. Oil experts, however, believe that the Bakken contains a lot more technically recoverable oil–20 billion barrels.[viii] Further, a new shale field, the Wolfcamp Shale formation in Texas, is touted to contain 50 billion barrels of oil, making it the largest oil field in the United States and the second largest in the world.[ix] A decade ago, modelers did not include shale oil and gas in their forecasts because shale formations were not considered economic to produce. Due to the higher oil prices that have dampened oil consumption and the advent of hydraulic fracturing and horizontal drilling technology, shale oil and gas production is the leading source of new hydrocarbon production in the United States.
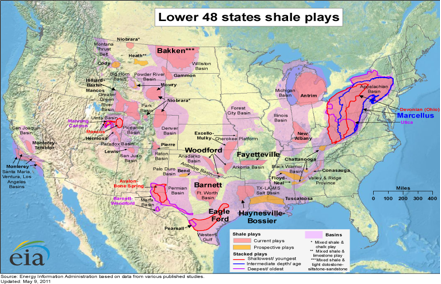
Source: Energy Information Administration, http://www.eia.gov/analysis/studies/usshalegas/
Conclusion
Oil and gas production in the United States is on the rise, but not due to federal government policies, but in spite of them. The production growth is taking place primarily on state and private lands due to far less red tape and much quicker processing times for permits. The increased production has brought prosperity to the states. For example, North Dakota’s unemployment rate is 3 percent, less than half the unemployment rate of the United States. With increased domestic oil production comes lower oil imports as oil demand in the United States has remained stagnant primarily due to high oil and gasoline prices, making consumers think twice about owning cars and taking that Sunday afternoon drive. The Obama Administration can try to take credit for the oil boom and the lessened dependence on foreign oil, but the data shows those claims are just more rhetoric.
[i] Energy Information Administration, Short-Term Energy Outlook, November 2013, http://www.eia.gov/forecasts/steo/pdf/steo_full.pdf
[ii] Washington Post, Improving U.S. oil production reaches milestone in October, agency says, November 13, 2013, http://www.washingtonpost.com/business/economy/improving-us-oil-production-reaches-milestone-in-october-agency-says/2013/11/13/dd01db86-4c97-11e3-9890-a1e0997fb0c0_story.html
[iii] ABC News, In Key Shift, US Oil Production Tops Net Imports, November 13, 2013, http://abcnews.go.com/Politics/wireStory/key-shift-us-oil-production-tops-net-imports-20877233?singlePage=true
[iv] Energy Guardian, Obama ties the decline of crude imports to green agenda, November 18, 2013, http://www.energyguardian.net/obama-ties-decline-crude-imports-green-agenda?utm_source=&utm_medium=email&utm_campaign=8572
[v] Congressional Research Service, U.S. Crude Oil and Natural Gas Production in Federal and Non-Federal Areas, February 28, 2013, https://www.instituteforenergyresearch.org/wp-content/uploads/2013/03/CRS-report-on-oil-and-nat-gas-on-federal-lands.pdf
[vi] Washington Post, Improving U.S. oil production reaches milestone in October, agency says, November 13, 2013, http://www.washingtonpost.com/business/economy/improving-us-oil-production-reaches-milestone-in-october-agency-says/2013/11/13/dd01db86-4c97-11e3-9890-a1e0997fb0c0_story.html
[vii] Energy Information Administration, Review of Emerging Resources: U.S. Shale Oil and Shale Gas Plays, July 8, 2011, http://www.eia.gov/analysis/studies/usshalegas/
[viii] Institute for Energy Research, North American Energy Inventory, December 2011,https://www.instituteforenergyresearch.org/wp-content/uploads/2013/01/Energy-Inventory.pdf
[ix] Oil & Gas Journal, Wolfcamp play dwarfs Bakken, Eagle Ford, August 12, 2013,http://www.ogj.com/articles/2013/08/urtech-wolfcamp-play-dwarves-bakken-eagle-ford.html?cmpid=EnlDailyAugust122013
