
The Institute for Energy Research (IER) has formally submitted its Comment to the Office of Management and Budget on the Obama Administration’s use of the “social cost of carbon” as an input for federal regulatory action. This is a crucial topic that may significantly influence energy policy. Those who want the full details should click the link and read our full Comment, but in a series of posts I will walk IER readers through the most important points we raised.
In our Comment, we objected to use of the “social cost of carbon” (SCC) in federal policy on several grounds. We grouped our objections into two categories, theoretical and procedural. In the present post, I will discuss the theoretical objections, meaning that even on purely academic or scientific grounds, it is very dubious to use SCC as a concept for guiding federal policymakers.
The SCC Is Not an Objective “Fact” of the World
On the theoretical front, our main theme is that the “social cost of carbon” is not an objective fact of the world, analogous to the charge on an electron or the boiling point of water. Many analysts and policymakers refer to the “science being settled” and so forth, giving the impression that the SCC is a number that is “out there” in Nature, waiting to be measured by guys in white lab coats.
On the contrary, by its very nature the SCC is an arbitrary number, which is completely malleable in the hands of an analyst who can make it very high, very low, or even negative, simply by adjusting parameters. Precisely because the SCC even at a conceptual level is so vulnerable to manipulation in this fashion, the analysts giving wildly different estimates are not “lying.” As we will see, the estimates of the SCC in the peer-reviewed literature are all over the map, demonstrating that this is hardly a feature of the “outside world.”
Damage Functions and Discount Rates
Incidentally, our conclusion is shared by some other experts, even those who are in favor of a carbon tax. In a peer-reviewed article, MIT Professor Robert Pindyck writes that computer-generated SCC estimates are “close to useless” for guiding policymakers, and that the “damage functions” embedded within the computer models are “arbitrary” having no basis in either economic theory or empirical observation. (Full quotations and citations are provided in our Comment.)
To get a sense of just how divergent the computer models can be, consider the following chart, which is taken from the 2010 Technical Support Document issued by the Obama Administration’s Working Group on the Social Cost of Carbon:
Annual Consumption Loss as a Fraction of Global GDP in 2100 Due to an Increase in Annual Global Temperature in the DICE, FUND, and PAGE models
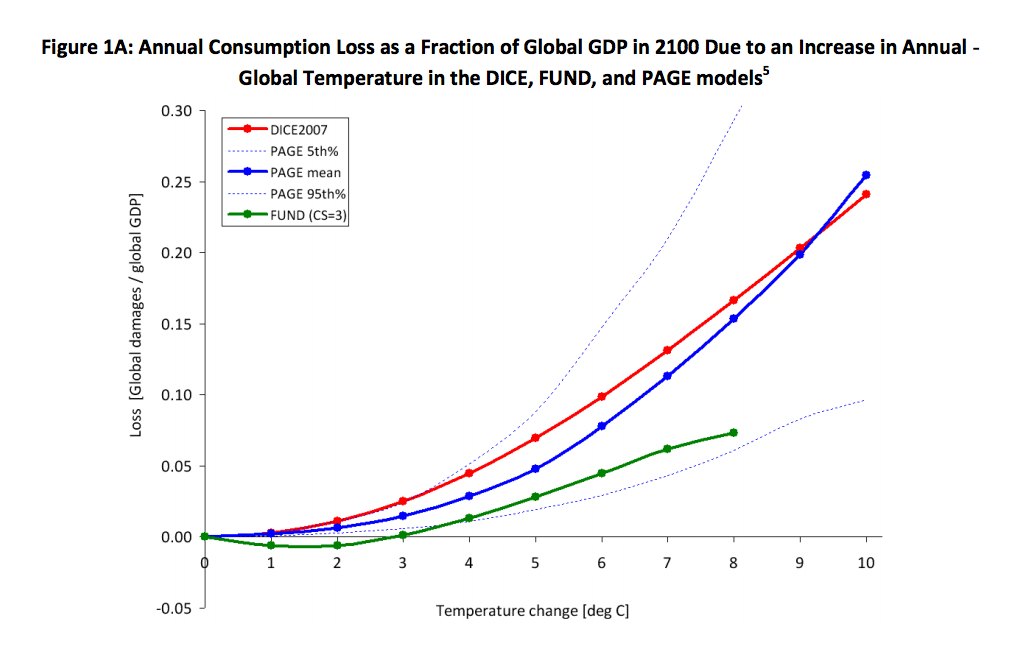
Source: Figure 1A (page 9) of February 2010 Working Group TSD
As the diagram above indicates, the three computer models selected for the Working Group analysis yield different results. In particular, the FUND model (green line) shows much lower impacts from global warming, especially at higher temperatures. Indeed, the green line’s initial (and slight) dip into negative territory shows that the FUND model assumes global warming will shower the world with positive externalities up through about 3 degrees Celsius. The fact that the FUND model yields (moderate) net benefits from global warming in the initial stages will be very significant when we consider the role of discount rates in the analysis.
When estimating the social cost of carbon (SCC), the choice of discount rate is crucial, because the computer simulations of large climate change damages occur decades and even centuries in the future, and also because some models show net benefits from global warming through mid-century.
Indeed, the Working Group generates its estimates of the SCC by equally weighting the estimates provided by the three computer models discussed above (namely the PAGE, FUND, and DICE models). As the diagram above illustrates, in the early decades (while the earth has only warmed one to two degrees Celsius) the cumulative impact of global warming is either close to zero or even positive.
Therefore, the rate at which we discount future damages into present monetary terms will have an enormous impact on the estimated SCC. For example, in the May 2013 Working Group update, the SCC in the year 2010 was reported as $11/ton at a 5% discount rate, but $52/ton at a 2.5% discount rate. In other words, cutting the discount rate in half caused the reported SCC to more than quadruple. Policymakers and citizens should realize just how influential the choice of discount rate is, when it comes to the SCC.
The problem is that the choice of discount rate is not something that can be settled objectively through technical analysis. If policymakers were going to use market rates of interest, there might be some hope of objectivity. There would still be significant “wiggle room” by selecting the time periods and particular interest rates to use in the computation, but at least market rates are externally generated and, in principle, could be measured objectively.
However, the trend in both academia and in policymaking circles is to use discount rates that are influenced by philosophical and ethical considerations, not based solely on observed market returns.[1] Presumably the proponents of one discount rate versus another may have strong arguments on their side, but the critical point is that these “ethical” discount rates are subjective and in an important sense, arbitrary.
Published Estimates of SCC All Over the Map
We can also look at a survey of the published estimates of the SCC over time, to demonstrate just how malleable and “subjective” the concept really is. The following diagram is taken from Richard Tol’s 2011 survey of past literature:
Survey of Published Estimates of SCC That Use 3% “Pure Time Preference” Rate for Discounting (dot indicates individual estimate).
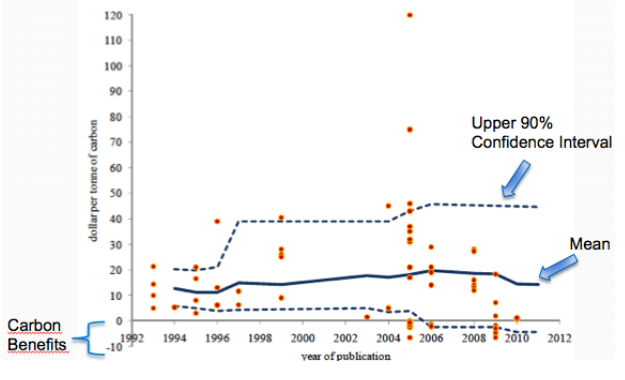
Source: Richard Tol. (2011) “The SCC,” ESRI Working Paper #377.
The diagram above is quite striking. It shows that the 90% confidence interval of the “true” SCC has widened over the last two decades. This is not what one would expect from a maturing science that is honing in on the “true” value. Even more shocking, from 2006 onward (at least until the time of Tol’s survey, in 2011) the lower portion of the 90% confidence interval was in the negative region of the graph, meaning that one could not rule out (with 95% confidence[2]) the possibility that further carbon dioxide emissions at that point would benefit humanity at large (beyond the private benefits accruing to the emitters).
The final takeaway from the above diagram is the enormous dispersion in the point estimates of the SCC. In particular, the 2005 estimates show a range from about negative $5/ton up to an enormous $120/ton. (Note that the y-axis on the above chart refers to tons of carbon, not carbon dioxide. Thus these values would need to be multiplied by 3.67 to make them comparable to the SCC estimates that are typically used in U.S. policy discussions.) This chart alone should disqualify use of the SCC in federal regulatory analysis and rule-making.
Conclusion
In this blog post, we have summarized some of the key theoretical problems with using the social cost of carbon (SCC) as a concept in federal policymaking. Generating estimates of the SCC involves using computer models with (arbitrary) simulated damages that go out centuries in the future, and then the analyst must arbitrarily select a discount rate to convert those future damages into present-dollar terms. Because of these ingredients in the estimation process, an analyst can generate just about any “estimate” of the SCC he wants, including a negative one—which would mean carbon dioxide emissions confer third-party benefits on humanity, and (using the Administration’s logic) ought to receive subsidies from the taxpayer.
[1] A good example of the current academic thinking on discount rates over centuries is Arrow, Kenneth et al. (2012) “How Should Benefits and Costs Be Discounted in an Intergenerational Context?” Resources for the Future Discussion Paper 12-53, December 2012, available at: http://www.rff.org/RFF/documents/RFF-DP-12-53.pdf.
[2] Because the interval is 90% confidence, the bottom region (below the interval) corresponds to only 5% of the probability range, meaning that anything above that threshold contains the true SCC with 95% probability.
