
Very cold weather increased the demand for natural gas used for home heating and for gas-fired electric generators in the Northeast, causing a spike in prices earlier this month. Prices spiked because of the increased demand for natural gas and because constrained gas pipelines could not handle the additional volume. Natural gas for all uses is increasing in the Northeast, and is expected to continue, as the EPA implements policies drastically reducing the use of coal fired generation and nuclear plants are being retired. The Northeastern states has been reducing their fuel diversity, but it is unclear whether decision makers are giving adequate consideration to the demands on natural gas–their replacement fuel of choice. New and expanded pipelines, more local production of natural gas and other means of obtaining abundant and reliable supplies are needed in the Northeast lest even more dramatic price shocks should occur due to inadequate supplies.
The recent cold wave should serve as an early warning signal to the people of the Northeast and their political leadership. On Monday, January 6, natural gas prices more than doubled in New England and almost quadrupled in New York. Electricity prices also spiked. On Tuesday, January 7, a megawatt-hour of electricity on the wholesale market, which normally sells for $40 or $50 was selling for $500 to $1,000 in New Jersey, Delaware and areas of Pennsylvania and Maryland. In parts of New England, the wholesale electricity prices were over $200. While in New York City, wholesale electricity prices were under $200 because electric utilities substituted oil for natural gas—oil, which is normally too expensive to burn as a generation fuel, was more economic than natural gas when the spike occurred.[i]
In New York, the higher natural gas prices caused a stir because New York has a moratorium on producing natural gas from the Marcellus shale formation using hydraulic fracturing. (Vermont and New Jersey also have prohibitions on fracking, though there is little shale availability in these states geologically.) As a result, New York is not letting its natural gas and electricity consumers benefit from local shale gas production. While New York will not let natural gas be produced within the state using hydraulic fracturing, it does use shale gas produced from the Marcellus formation in Pennsylvania, whose consumers benefit from its production. According to the Energy Information Administration, natural gas prices in Pennsylvania in 2013 were only 11 percent higher than in 2012 due to continued growth in production from the Marcellus shale compared to price increases of 61 percent in New York and 75 percent in New England – states that must import natural gas from other states, Canada, or from aboard as liquefied natural gas.[ii]
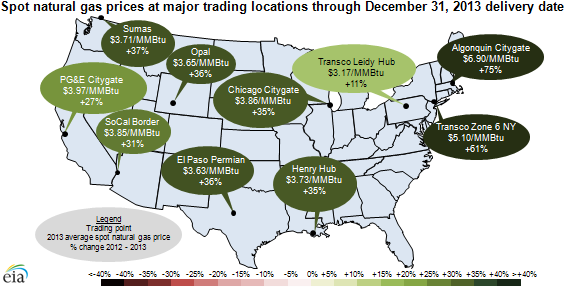
Source: Energy Information Administration, http://www.eia.gov/todayinenergy/detail.cfm?id=14491&src=email
The Changing Energy Market in the Northeast
The natural gas drilling boom in shale fields due to the use of hydraulic fracturing coupled with horizontal drilling led to a plunge in gas prices that caused an increase in natural gas-fired generation and a shift from heating oil to natural gas in the Northeast. Natural gas generated less than 30 percent of New England’s electricity in 2001, but provides more than 50 percent today. Natural gas pipelines are able to handle the increased demand during the summer months, but the pipelines become constrained in the winter due to the added demand for heating, particularly in very cold weather. During the cold spell, some power providers imported more gas from Canada through pipelines that have become underused in recent years due to the domestic shale gas renaissance and from abroad as liquefied natural gas.
Twenty interstate pipeline systems operate between Virginia and Maine, delivering gas from the Marcellus field, the Gulf of Mexico, and Canada. Due to several regional natural gas price spikes occurring last winter, several gas pipeline expansion projects were completed over the past year connecting the Marcellus field to New York and New Jersey. More expansions are scheduled through 2015. Additional pipeline service to New England, an expansion of Spectra Energy’s Algonquin Incremental Market pipeline project bringing new Marcellus gas production through Connecticut, Massachusetts and Rhode Island, is anticipated for 2016.
Unfortunately, the expected retirement of coal-fired plants, such as the Brayton Point power plant in southeastern Massachusetts, the largest coal-fired plant in New England[iii] with 1,055 megawatts of coal-fired capacity and 435 megawatts of natural gas-fired capacity, scheduled to be shut down in 2017, will cause even more pressure on pipelines to deliver natural gas to the area. The Institute for Energy Research has found that over 1,100 megawatts of capacity in the Northeast are expected to be prematurely retired due to EPA’s Mercury and Air Toxics Rule (colloquially called Utility MACT) and the Cross State Air Pollution Rule (CSAPR).[iv]
Not only are coal-fired power plants retiring prematurely, but nuclear plants as well. On August 27, Entergy announced the pending closure of the Vermont Yankee plant, which is expected in the fourth quarter of 2014, when the plant’s current fuel cycle ends. The closure of this 41-year-old nuclear plant is expected to affect natural gas and electricity markets throughout New England because the plant had been generating about 4 percent of New England’s electricity supply and about three-quarters of Vermont’s power. Entergy cited a number of financial factors for the retirement including increased costs to comply with new federal and regional regulations. Because Vermont Yankee is operated as a merchant generator, its costs cannot be recovered through regulated cost-of-service rates.[v]
New England expects more than 1,369 megawatts of generating capacity to be retired between 2013 and 2016. Dominion Energy Resources is planning to retire the nearly 750-megawatt Salem Harbor coal- and petroleum-fired power plant in Massachusetts in 2014 due to the costs of compliance with new environmental regulations and declining profits for coal-fired units in Independent System Operator (ISO) of New England.[vi] To keep operating its coal-fired power plants, the company would need to spend millions of dollars on environmental equipment to comply with EPA regulations.
Reliability experts are noting that the New England grid is entering risky territory. With the above early retirements, and other resources contemplating closure, the New England grid is becoming dangerously reliant on natural gas. The ISO New England, the electric grid operator, recommended against the closure of the 1500 megawatt Brayton Point facility because the plant is needed to ensure reliability.[vii]
Clearly, the amount of electricity from natural gas fired plants in New England will be increasing beyond its current 52 percent share due to these premature retirements of nuclear and coal-fired power plants caused primarily by onerous federal regulations. This turn of events is also dangerously narrowing energy diversity in the region. Energy diversity is needed due to pipeline constraints for moving natural gas and future expected increases in natural gas prices.
Conclusion
If government leaders in the Northeast and throughout the country are looking to natural gas as the answer to their future energy needs, it is important that the infrastructure be available to transport needed energy from sources of supply to demand areas, particularly when demand increases quickly due to extremely cold weather when consumers need the energy for warmth. If the infrastructure is sufficient, large price spikes will be less likely to occur. In the case of the Northeast this month, the availability of Canadian gas and liquefied natural gas helped to alleviate even larger price spikes.
However, a separate cause for concern is the lessening in diversity in Northeast energy markets with natural gas used for electric generation increasing from a 30 percent share to over 50 percent in New England, coal-fired generators being prematurely retired due to onerous regulations from the EPA, and natural gas displacing heating oil because of its favorable economics. This trend will put an even larger strain on inadequate pipeline infrastructure, and likely lead to price spikes and other disruptions if care is not taken to ensure adequate production and flow of energy. The recent cold spell should serve as a wakeup call to those whose policies have consequences for consumers, businesses and jobs.
[i] New York Times, As Winter Takes Hold, Plunging Temperatures Test Utilities, January 8, 2014, http://www.nytimes.com/2014/01/09/business/energy-environment/as-winter-takes-hold-plunging-temperatures-test-utilities.html?nl=todaysheadlines&emc=edit_th_20140109&_r=2
[ii] Energy Information Administration, New England and New York have largest natural gas prices increases in 2013, January 7, 2013, http://www.eia.gov/todayinenergy/detail.cfm?id=14491&src=email
[iii] Boston Globe, Largest coal-fired plant in NE to close by 2017, October 8, 2013, http://www.bostonglobe.com/business/2013/10/07/largest-coal-fired-plant-close/WeTEdGAz9CmyFwQtWCqIMN/story.html
[iv] Institute for Energy Research, Impact of EPA’s Regulatory Assault on Power Plants, June 12, 2012, https://www.instituteforenergyresearch.org/wp-content/uploads/2012/04/June-12-EPA-powerplant-shutdown-update.pdf
[v] Energy Information Administration, Vermont Yankee nuclear plant closure in 2014 will challenge New England energy markets, September 6, 2013, http://www.eia.gov/todayinenergy/detail.cfm?id=12851
[vi] Dominion News, Dominion Sets Schedule to Close Salem Harbor Station, May 11, 2011, http://dom.mediaroom.com/index.php?s=26677&item=71797
[vii] Forbes, More Coal Plant Retirements in New England? Perhaps Not So Fast, January 6, 2014, http://www.forbes.com/sites/peterdetwiler/2014/01/06/more-coal-plant-retirements-in-new-england-perhaps-not-so-fast/
