
Many U.S. states have renewable portfolio standards that require a certain percentage of electricity to come from renewable sources, mostly wind and solar power. These mandates are supposed to reduce greenhouse gas emissions, and while they do, a recent study found that they are a very costly means to do so. Researchers at the University of Chicago found, among other things, that the effective price per ton of carbon dioxide emissions reduced ranges between $130 and $460. Researchers at the University of Chicago found, among other things, that the effective price per ton of carbon dioxide emissions reduced ranges between $130 and $460, dwarfing even the harshest of carbon tax proposals. The study also showed that consumers have paid $125 billion more for electricity as a result of renewable mandates seven years after passage of the policy.
Renewable Portfolio Standards (RPS)
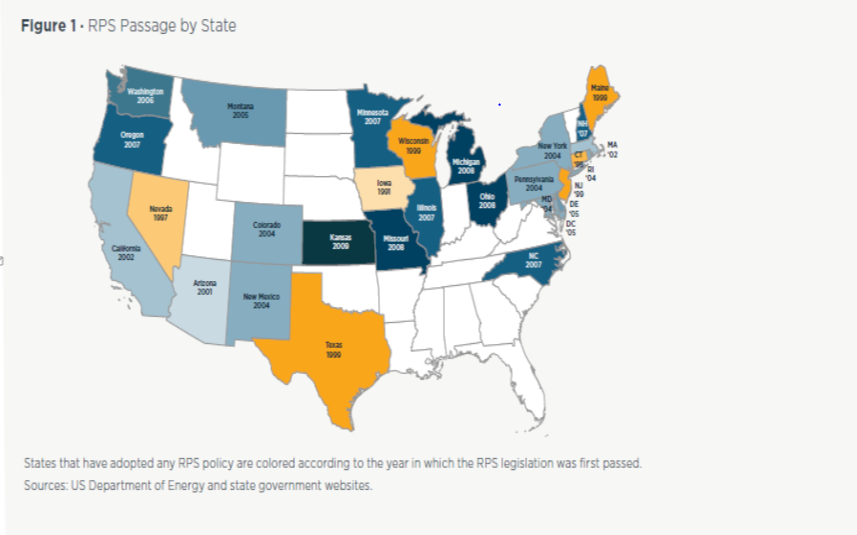
A renewable portfolio standard is a regulation that requires the increased production of electricity from renewable energy sources, such as wind, solar, biomass and geothermal. Another name for the concept is Renewable Electricity Standard. The mandate places an obligation on electricity supply companies to produce a specified fraction of their electricity from renewable energy sources. Renewable portfolio standards have been enacted by 29 states and the District of Columbia. Puerto Rico recently passed a 100 percent renewable mandate.
The University of Chicago Study
The university researchers compiled a data set on RPS program characteristics and key outcomes covering 1990 to 2015, and compared that data for states that did and did not adopt RPS policies, taking into account the different years of enactment of the policy. The study estimated the impacts of the RPS policies on electricity prices, electricity consumption, renewable penetration, carbon dioxide emissions, and economic activity.
The researchers found that RPS programs significantly increase average retail electricity prices, with average prices increasing by 11 percent (1.3 cents per kilowatt hour) seven years after the policy’s passage into law and 17 percent (2 cents per kilowatt hour) twelve years after the policy’s passage into law. Consumers in the 29 states paid $125.2 billion more for electricity than they would have in the absence of the policy seven years from passage.
The researchers also found that seven years after adoption of an RPS program, the required renewable share of generation is 1.8 percentage points higher, and at twelve years after adoption, the required renewable share of generation is 4.2 percentage points higher than it would be without the RPS programs.
The increased renewable generation results in reduced carbon intensity of the electricity grid in the states with RPS programs. By increasing the share of renewable generation, the states with an RPS policy saved 95 to 175 million tons of carbon emissions seven years after the start of the programs. But, the researchers found that the cost of abating carbon dioxide emissions through an RPS policy is over $130 per metric ton of carbon dioxide and as much as $460 per metric ton of carbon dioxide.
These costs are several times higher than estimates of the social cost of carbon used by the Obama Administration, which in today’s dollars would be about $50 per ton. They are also much higher than the $5 used in the northeast’s Regional Greenhouse Gas Initiative (RGGI) and the $15 in California’s cap-and-trade system. These lower carbon prices, however, may be too low to actually change behavior and reduce emissions.
The Chicago University study differs from most studies that evaluated RPS programs because the latter studies examined only the differences in the costs of generation between renewable technologies and traditional generating technologies. Those studies did not incorporate the following three major costs that the addition of renewable resources impose on the electricity system:
- The intermittent nature of renewables that require back-up capacity,
- The substantial additional transmission capacity that renewables require because they take up a great deal of physical space, are geographically dispersed and are frequently located away from population centers, and
- The baseload generation that is prematurely displaced, imposing costs on ratepayers and owners of capital, when renewable capacity is built during times of adequate supply of generating capacity.
State Activity
Despite these results, at least six states, including New Mexico, New York and Arizona, have recently increased their renewable mandates, and more than a dozen others are considering similar moves. In mid-April, lawmakers in Nevada passed a bill to double their RPS to 50 percent by 2030. Maryland legislators approved a similar bill a week earlier. Minnesota and New York are both considering bills that would require all electricity come from carbon-free generation in future decades, which have already been enacted in Hawaii, California, Nevada and Washington DC.
Conclusion
Renewable Portfolio Standards have increased electricity prices and lowered the carbon intensity of the states that have enacted them. However, the cost of reducing carbon dioxide emissions in those states is very expensive in the order of hundreds of dollars per metric ton of carbon dioxide reduced. In many of those states, there was no need to even construct additional power plants because existing electric capacity was sufficient to meet demand. It could be said that in such places, political decisions have treated electricity as a luxury product, even though to consumers it is necessary for everyday life, regardless of its source. Clearly, renewable portfolio standards are not in the best interests of consumers, raising their electric rates and paying dearly for reductions in carbon dioxide emissions.
