
Why Are Gasoline Prices High and Rising?
“Our demand was so low last year that we basically had nowhere to go but up,” according to AAA spokesman Clay Ingram
As of March 9, 2021, gasoline prices in the United States are averaging $2.80, 13 percent higher than a month ago. The purpose of this post is to explain why this increase is occurring.
Gasoline prices are composed of four main components: 1.) supply and demand for oil in a global market, 2.) taxes levied by federal, state and local government, 3.0) distribution and market costs, such as the costs incurred by local gas station owners, and 4.) the cost of refining crude oil to turn it into gasoline.
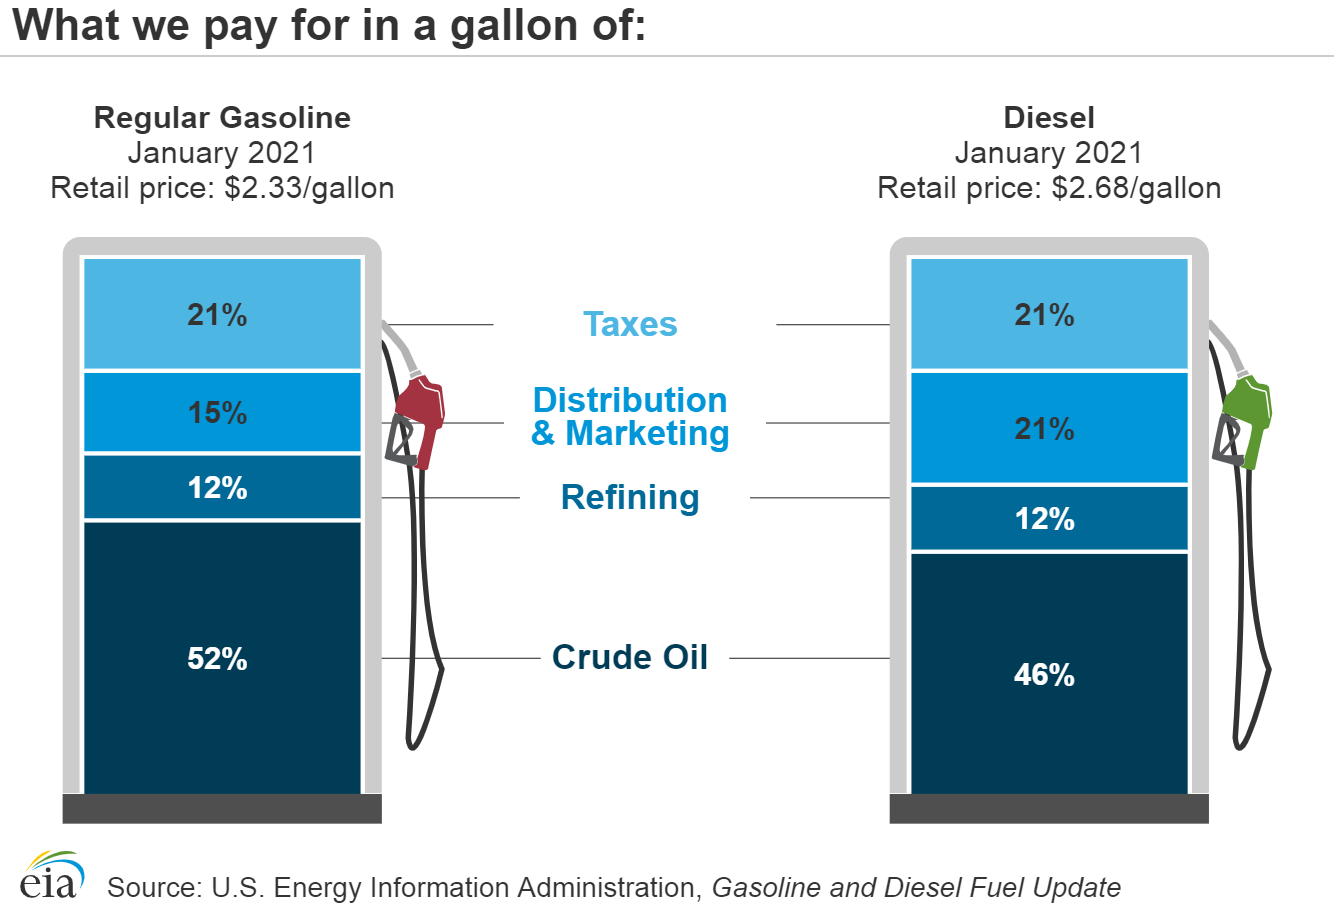
The largest component of the price of gasoline is the price of oil, which made up 52 percent of the price at the pump in January 2021. This is followed by taxes that represent 21 percent of the price, distribution and marketing costs at 15 percent, and refining costs at 12 percent. The cost of distribution varies with seasonal changes as refineries retool to switch from winter grade to summer grade gasoline, perform regular maintenance on their facilities, and fix any break-down of equipment. It also varies as global markets change (e.g. the coronavirus pandemic) and as government taxes increase.
Currently, several refineries have been down due to freezing weather that hit Texas and a number of other oil and gas producing states that also have refineries. During mid-spring, refineries also close for maintenance and switchover to summer fuels required to meet air quality standards that is a result of normal operations. With limited refinery capacity in the United States, the removal of some refineries from the production of gasoline results in higher prices. Along with refinery outages, gasoline prices increase due to higher prices for oil on world markets because of increasing world demand, and production quotas by OPEC+ countries (OPEC and its partners) and geopolitical events such as the Yemen’s Iran-aligned Houthi rebels attacking a major Saudi Arabian oil port on the Persian Gulf (Ras Tanura) with drones and missiles on March 7. The result is the gasoline price increases we have seen over the past several weeks.
Lowering world oil demand or increasing world oil supplies would lower oil prices, but the United States can neither affect the oil demand of other countries nor can it increase the supply of oil from other oil producing countries. It can increase its own oil supplies, which are coming back to production after the downturn during the height of the coronavirus pandemic and the recent freeze. However, President Biden’s policies of placing a moratorium on drilling on federal lands in order to review drilling policy will put a damper on future U.S. oil production. And, the signal that Biden sent to markets with the cancellation of the Keystone XL pipeline on his Inauguration Day is a strong indication that producing oil and gas in America is going to become more difficult during his administration.
Besides reducing oil demand or increasing oil supply, U.S. gasoline prices can be lowered by lowering refining costs, decreasing gasoline taxes, or decreasing marketing and distribution costs, but as the figure above shows, these components of the cost of gasoline are small compared to the price of oil.
1) Supply and Demand for oil
a) World Oil Demand Growth: World crude oil and liquid fuels demand increased after the height of the coronavirus pandemic and is 8 million barrels per day greater than production. Demand has recovered in China and India and is on the upward spiral in the United States and Europe. U.S. petroleum demand, as measured by total petroleum products supplied, was 19.4 million barrels per day in January 2021, according to the latest monthly statistical report by the Energy Information Administration (EIA), a 4 percent increase from December and a decrease of only 2.3 percent compared with January 2020. If world demand for oil rises faster than oil companies can produce the crude, oil prices will go up, which is what is occurring now.
b) Domestic Supply: According to the EIA, the United States produced 3 million barrels per day of crude oil natural gas liquids in January 2021, down from 17.9 million barrels per day in January 2020 before the pandemic — a 26 percent decline. Only a small portion of federal lands are leased to oil and gas drilling. More domestic oil could be produced if the federal government permitted it and if its regulatory procedures were commensurate with state regulation that is more conducive to exploration and drilling. This is exasperated by President Biden’s moratorium on drilling on U.S. federal lands to review domestic policy mentioned above.
c) OPEC Production Restraints: OPEC and its partners have restricted the production of oil in order to increase prices which fell when demand bottomed out during the pandemic. OPEC and its allies indicated that they will rollover current production cuts to the end of April. Russia and Kazakhstan were the only exceptions and were allowed to increase production by 130,000 and 20,000 barrels per day, respectively, due to “continued seasonal consumption patterns”. Saudi Arabia also extended its voluntary output cut of one million barrels per day, which was due to expire at the end of March, through the month of April. OPEC+ appears to be responding to the uncertainty around the demand outlook by taking a more cautious approach. Further, OPEC+ does not believe that U.S. oil production will be able to respond to the higher price environment any time soon. Forecasters are looking at $75 or $80 a barrel oil in the 2nd and 3rd quarters of this year.
OPEC exporting nations possess much of the world’s known conventional oil reserves, and as such, have excess production capacity. However, in order to maintain favorably high oil prices to fund their governments and sustain their production capabilities, these nations agree on production targets that curtail the supply of oil from member states.
In addition, oil prices are buoyed due to unrest in the Middle East. Recently, Yemen’s Iran-aligned Houthi rebels attacked a major Saudi Arabian oil port on the Persian Gulf (Ras Tanura) with drones and missiles. Despite Saudi authorities indicating the strike caused no casualties or damage, oil prices increased after the market opened in New York following the attack. Brent crude added more than 2.5 percent, rising above $71 a barrel. Prices surged to their highest level since May 2019, due to rising demand as the global economy reopens from shutdowns caused by the coronavirus and supply curtailments in many producing countries.
Saudi Arabia responded by dropping bombs on Yemen’s rebel-held capital San’a. The coalition blamed the Biden administration for the attacks by Iran-backed Houthi rebels after a decision to remove them from U.S. terror lists. The price of Brent crude was down to $68.76 a barrel, after hitting a high of $71.38 a barrel. It was the first time the global benchmark has traded above $70 since January 2020. The Houthis stepped up aerial attacks on Saudi Arabia following the inauguration in January of President Biden, who pledged to end the six-year-old civil war in Yemen and recalibrate Washington’s relationship with Riyadh. Much has happened to world and U.S. oil markets since the advent of the Biden Administration.
d) Oil Imports and North American Oil Supplies: Petroleum is a globally-traded commodity. On net, the United States exported more oil and petroleum products than it imported in 2020 and in the first month of 2021 due to hydraulic fracturing and horizontal drilling greatly increasing U.S. oil production. The United States still imports some crude oil and petroleum products due mostly to geography and type of crude oil, since U.S. refineries are set up to use heavier crude oil. For example, the United States purchases crude oil from Canada, its largest foreign supplier, and sells Canada a small amount of crude oil produced in Alaska. The United States also purchases crude oil from Mexico and sells Mexico gasoline in return.
Canada, our neighbor and ally to the North, has the third largest reserves of oil in the world at 170 billion barrels. It currently sells us about 4 million barrels per day and could easily sell us more if the transportation infrastructure were in place to move it to U.S. refineries. However, with the Biden administration shutting down construction of the Keystone XL pipeline, more expensive forms of transportation such as rail are moving some of this oil to U.S. markets. Because Canadian crude is currently land-locked, its price is much below that of Brent crude, making more expensive rail transportation economic.
U.S. crude oil that is land-locked in North Dakota and at Cushing, Oklahoma storage terminals also is lower priced than foreign overseas oil. Ships could be used to move this lower priced oil to East Coast markets where overseas oil is used if the 1920 Jones Act were repealed. The Jones Act requires that shipments from one U.S. port to another be carried on vessels built in the United States, owned by U.S. citizens, and operated by a U.S. crew.
2) Federal and State Taxes
The second main cost of the price of gasoline is federal and state taxes. In January 2021, federal, state and local taxes accounted for 21 percent of the price of gasoline. The federal tax on gasoline accounts for 18.4 cents per gallon, while the volume-weighted average state and local tax is 36.8 cents per gallon as of January 2021. This amounts to a 55.2 cent nationwide average tax on gasoline that governments get each time you pump a gallon.
3) Distribution and Marketing Costs
The third component of the price of gasoline is the retail dealer’s costs and profits, which constituted a combined 15 percent of the cost of a gallon of gasoline in January 2021. From the refinery, most gasoline is shipped first by pipeline to terminals near consuming areas and then loaded into trucks for delivery to individual stations. Ethanol (currently about 10 percent of a gallon of gas) must also be transported by truck or train since it cannot be transported by most pipelines prior to delivery due to its affinity to absorb water.
Even though many gas stations are branded as Shell, Exxon, BP or another major oil company, the major oil companies actually own less than 5 percent of gas stations. They have largely left the retail business. The vast majority of gas stations are actually independent businesses that purchase gasoline for resale to the public. In addition, some retail outlets are owned and operated by refiners.
The price at the pump reflects both the retailer’s purchase cost for the product and the other costs of operating the service station. It also reflects local market conditions and factors, such as the desirability of the location, ease of access for bulk fuel transport and the marketing strategy of the owner.
4) Refining Costs
The last cost to factor into the price of gasoline is the refining process, where crude oil is “cracked” and formulated into its chemical components and made into gasoline. In January 2021, refinery costs comprised 12 percent of the retail price of gasoline. This figure varies regionally because different parts of the country require different additives and processing steps in their gasoline formulations. The figure of 12 percent would also vary over different months, owing to seasonal changes in refinery operations. For example, in the spring when refineries need to retool to produce summer-blend gasoline and to meet summer gasoline demands, the cost of refinery operations is higher.
Currently, gasoline production is at a low because refineries have been affected by the low demand from the coronavirus pandemic and the freeze experienced last month throughout parts of the south and Midwest, which points to the lack of excess refining capacity in this country. As a matter of fact, China will surpass the U.S. in refining capacity this year for the first time in history.
Conclusion
Gasoline prices are high and increasing because world oil demand growth is outpacing oil supply output, thereby increasing oil prices and gasoline prices. This is mainly due to the lower oil production because of the lowered demand from the coronavirus pandemic and the supply cuts by OPEC+. Further exasperating world markets are the geopolitical factors occurring in the Middle East, combined with uncertainties of government policies in the United States, the world’s largest oil producer. Gasoline prices are further being boosted because of lack of available refining capacity due to the recent freeze and lowered demand from the coronavirus pandemic. President Biden’s policies are not helping in that he has killed the Keystone XL pipeline that would bring lower priced oil from Canada and lower transportation costs from the Bakken fields of North Dakota and surrounding states. He has also placed a moratorium on oil and gas drilling on federal lands that could affect future production.
