

GREEN JOBS: Fact or Fiction?
An Assessment of the Literature
January 2009
By Robert Michaels and Robert P. Murphy

Introduction and Executive Summary
I. Green Recovery, Center for American Progress
II. Job Opportunities for the Green Economy, Political Economy Research Institute
III. Current and Potential Green Jobs in the U.S. Economy, Global Insight
IV. Renewable Energy and Energy Efficiency, American Solar Energy Society
Introduction and Executive Summary
Data compiled and recently released by the National Bureau of Economic Research (NBER) indicates that not only is the U.S. economy currently in recession, it has been for more than an entire year (since December 2007). What started as a financial crisis on Wall Street quickly evolved into a much deeper economic crisis on Main Street, with unemployment now at a 16-year high. What’s worse, the recovery seems elusive, and a prolonged recession cannot be ruled out. Keynesian economics is once more fashionable in the corridors of power in Washington, with plans taking shape for a massive infrastructure program (much of it expected to be “green”) to get the economy moving again.
In this environment, some have seized upon the “Green Economy” as a cure for both the nation’s current economic ills, and as a way to address the issues of global warming and energy security. According to this view, government at all levels can use fiscal and regulatory measures to spur massive new investments in renewable energies and energy efficiency, which will create millions of new “green jobs.” Proponents claim that such programs will not only rescue the economy from recession, but will also put the country on track to a sustainable, low-carbon energy future. The new Administration and the incoming 111th Congress are in apparent agreement with this overall strategy, differing perhaps only in the details.
Unfortunately, it is highly questionable whether a government campaign to spur “green jobs” would have net economic benefits. Indeed, the distortionary impacts of government intrusion into energy markets could prematurely force business to abandon current production technologies for more expensive ones. Furthermore, there would likely be negative economic consequences from forcing higher-cost alternative energy sources upon the economy. These factors would likely increase consumer energy costs and the costs of a wide array of energy-intensive goods, slow GDP growth and ironically may yield no net job gains. More likely, they would result in net job losses.
In the present article we critically examine four recent studies on the alleged benefits of government programs to foster green job creation: the Center for American Progress’ (CAP) Green Recovery: A Program to Create Good Jobs and Start Building a Low-Carbon Economy [i], the Political Economy Research Institute’s (PERI) Job Opportunities for the Green Economy: A State-by-State Picture of Occupations that Gain From Green Investments [ii], the U.S. Conference of Mayors’ Current and Potential Green Jobs in the U.S. Economy [iii], and finally the American Solar Energy Society’s (ASES) Renewable Energy and Energy Efficiency: Economic Drivers for the 21st Century [iv]. Although each report is unique, a common characteristic is that they all rest on incomplete economic analysis, and consequently greatly overstate the net benefits of their policy recommendations. Below we summarize these general problems, while in subsequent sections we analyze each report in turn.
Mistaking a labor-intensive energy sector as the goal, rather than efficient energy provision.
Energy is the lifeblood of the economy. The primary objective of the energy sector is to supply cost-effective energy to the broader economy, allowing it to grow and increase the standard of living of its citizens. Artificially pumping up employment in the energy sector per se—and thereby driving down productivity, while driving up costs to the broader economy—is counterproductive to overall net job creation and economic growth. It is a sign of increased efficiency if more energy can be produced and delivered with fewer workers, because this expands the overall output potential of the economy. Yet the green jobs studies that we analyze in this report reach the opposite conclusion, and favor energy sources that require more workers to yield a given amount of energy. By analogy, the number of workers in the U.S. devoted to agriculture has steadily declined over the last century, and this is a healthy sign of progress in the U.S. economy. Government efforts to reverse the trend, and force more workers back into agriculture, would not “create jobs” in the long-run, but would simply raise food prices and shrink other sectors.
Counting job creation but ignoring job destruction.
Even if job creation per se is the goal, the studies fail to properly account for the job destruction that their recommendations would entail. For example, the Center for American Progress (CAP) study recommends a $100 billion expenditure to be financed through the sale of carbon allowances under a cap-and-trade program. CAP estimates that this “fiscal stimulus” will result in the creation of two million jobs [v]. Yet the CAP methodology treats the $100 billion as manna from heaven; it does not consider the direct and indirect adverse effects (including job destruction) of imposing higher costs on a wide array of energy-intensive industries and thereby raising prices for consumers.
Double counting of jobs and overly simplistic treatment of the labor market.
The green studies critiqued in this report implicitly assume that there is a limitless pool of idle labor which can fill the new “green” slots created by government spending. Yet to the extent that some of the new green jobs are filled by workers who were previously employed, estimates of job creation are overstated, perhaps significantly so. In addition, the studies do not account for the rise in worker productivity over time. Thus their long-range forecasts of total jobs created by green programs are inflated, even on their own terms.
To its credit, CAP alludes to potential “inflationary labor shortages from job creation” [vi] due to its proposed program, but dismisses the concern as irrelevant for an economy in recession. The thinking is that the workers going into the new green jobs will simply reduce the unemployment rate, rather than siphoning talented people away from other industries. The CAP analysis ignores the fact that other industries, not favored by the green subsidies or mandates, would have been able to draw on the pool of unemployed workers as the economy recovers. With fewer workers seeking jobs, job creation in “non-green” sectors will be lower than it otherwise would have been. Moreover, some of the infrastructure plans will require a long time to implement and then reach completion. Their implementation over time could contribute to “inflationary labor shortages” once the current recession has passed.
Ignoring the role of the private sector.
Nowhere in CAP or the other three studies is there a discussion of the role of the private sector in their proposed green jobs programs. No consideration appears to have been given to the fact that government cannot direct the labor and capital markets more efficiently than market wage and interest rates. In fact, history is replete with evidence that government lacks this ability. The syn-fuels program of the late 1970s is a classic example of labor and capital being pulled, at government’s direction, into lower-value uses than the industries into which market forces would have channeled them. The studies also omit any discussion of cutting the marginal tax rates on labor and capital to increase incentives to work and invest. Arguably this is the most effective, and only sustainable way to revive economic growth.
How much government support of “green” markets is enough? Are the programs sustainable?
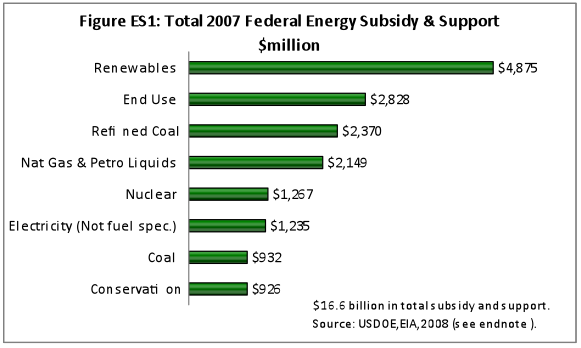
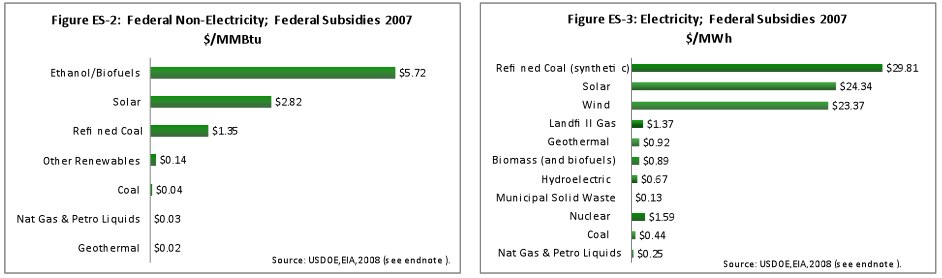
The studies propose potentially massive government intervention in energy markets, both with respect to electricity generation and transportation fuels. It is important to consider the current levels of subsidies before considering further market intervention in the energy markets. In FY 2007, total federal energy subsidies were estimated by the U.S. Department of Energy’s Energy Information Administration (DOE EIA) [vii] at $16.6 billion, spread across more than a dozen energy sources as seen in the figures at the right and below.
On an absolute dollar basis, renewables receive over twice the level of subsidies compared with conventional energy sources. And on a dollar per Btu or MWh basis, the level of subsidy of renewable energy is orders of magnitude (more than 100 times) greater than levels for conventional energy.
Government picking of winners and losers, a classic example of unsound energy policy.
All sources of commercially viable energy have a role in supplying the energy required by U.S. consumers and the nation’s economy. In fact, at some point in the future—especially if oil prices return to their previous levels—it may be efficient for the United States to obtain a significantly larger share of its electricity and transportation needs from renewable energy sources. However, the programs proposed in the studies reviewed in this paper would require, at some level, government officials to make choices as to which technology areas to further support/subsidize (solar, wind, ethanol, etc.). It is very unlikely that government-directed programs picking winners and losers would yield a more efficient energy mix than what would be determined in the market absent massive government intervention. On what basis will government officials make the decisions as to what technologies to support, and given the existing levels of subsidies, would the additional levels of support be sustainable in the future?
Similar reasoning applies to assessments of efficiency measures that “pay for themselves.” If adding new insulation, or installing a solar panel, really would save more money than the initial cost (including interest), then it is unclear why governments need to further subsidize the improvements. Presumably private business and households do not need to be aided in the process of furthering their self interest.
Assuming that potential benefits from new technologies will only occur through government programs.
Another major issue with the studies is to conflate the benefits of new technologies and energy efficiency, with the benefits of government programs in these areas. For example, the American Solar Energy Society (ASES) report estimates that by 2030, the state of Ohio could see two million jobs related to energy efficiency [viii]. Such figures lead it to conclude that “if we fail to invest in RE&EE [renewable energy and energy efficiency], the United States runs the risk of losing ground to international RE&EE programs and industries.” [ix] But if the “we” refers to taxpayers, rather than private investors, the ASES argument is unsound. After all, many industries will provide millions of jobs for Ohio in the year 2030, and this happy outcome doesn’t require government funding or oversight.
Having summarized some of the major shortcomings common to the four studies, we now proceed to an analysis of each
I. Green Recovery, by Pollin et al., Center for American Progress (CAP)
Both of Pollin’s papers, Center for American Progress and Political Economy Research Institute (CAP and PERI), are built around a policy that will allocate $100 billion from the federal government among six “green economy” strategies: retrofits to buildings, expansion of mass transit, building a “smart” electric grid that allows better management of production and consumption, expanding wind power, expanding solar power, and promoting research in “next generation” biofuels [x]. In this section we discuss the CAP study, while in Section II we address the PERI study.
A. No Free Lunch on Emission Allowances: Study Fails to Incorporate the Costs of the Proposed Program
CAP sees a need for only two annual deficit payouts of $100 billion. It expects that in two years the federal government will be auctioning permits required to emit greenhouse gases, and that the program will produce $75 to $200 billion in annual revenue [xi]. If so, as the reasoning goes, the government can invest it in the green program with no adverse effects as business will pay for the permits. In reality the requirement to purchase the permits amounts to a new tax that must be borne by someone. Either output prices will rise or the profits that can be reinvested in businesses will fall. Either way, some of the demand for the economy’s output will vanish. The CAP study touts the benefits of a “multiplier,” whereby federal spending of $100 billion leads to spillover benefits, increasing the total economic expansion beyond the initial injection. Yet CAP fails to acknowledge that this multiplier effect also works in reverse. If carbon-intensive industries must pay an additional $100 billion to the federal government to purchase emission permits, then ultimately this implicit tax hike will contract economic output beyond this figure, because workers in the penalized industries now have less money to spend on local goods and services such as restaurants, etc. The government doesn’t create wealth simply by taking $100 billion from one group of firms and handing it over to a different group of businesses.
B. Flawed Measurements of Green and Other Jobs
The CAP study generates its main results through three steps: (1) estimating the direct effects of the spending on workers and goods, (2) using an input-output table which estimates the “indirect” effect on employment due to purchases made by the direct recipients, and (3) estimating “induced” jobs that come from later rounds of re-spending through a “multiplier” process. CAP’s readers will be unable to trace the path of the calculations in (1) and (2) because it does not present the complex underlying model, instead promising full details in a forthcoming study [xii]. Because CAP has no explicit model to generate induced jobs, the authors searched the economic literature for multiplier values. Faced with a range of possible values (some negative), they arbitrarily chose to estimate them as 1/3 of the total direct and indirect jobs, asserting that the choice was “conservative.” [xiii]
Despite the appearance of sophistication, the CAP analysis generates spurious numbers because of the improper underlying assumptions. In subsection A above, we have already discussed the problem with the “multiplier” approach: it counts the positive spillover effects on job growth from an exogenous increase in spending, but the analysis doesn’t use the same approach to account for the destruction of economic activity from the tax hike (or deficit increase) needed to fund the original injection of federal dollars. The CAP analysis neglects the adverse economic impacts that its recommended cap-and-trade system would yield, particularly for energy-intensive goods and services.
Finally, the input-output model implicitly assumes an infinitely elastic supply of unemployed workers. The CAP analysis counts up all of the jobs created directly and indirectly as a result of the green jobs program, but it does not account for the fact that at least some of those workers (and the money they in turn spend) will be siphoned from other industries. To the extent that some of the workers in the new, green positions simply will have moved from previous jobs, obviously there is no increase in total “spending” in the economy. In fact such cases present net losses to total output, because the government intervention directs those workers from higher-valued occupations into lower-valued ones. (If the opposite were true, then it wouldn’t take federal programs to move the workers.)
C. CAP’s Unrealistic Model of Labor Markets
CAP’s basic model of unemployment is very unrealistic. Unemployment is almost everywhere a transitional stage in which a person moves between a job that he or she no longer has (possibly because of a voluntary separation) and an open vacancy. CAP instead envisions a large number of unemployed who have for some reason lost their jobs and would take any that were available, if only someone (here the government) spent enough money to fund the positions. As an example, CAP notes that employment of construction workers dropped by 800,000 between July 2006 and July 2008 [xiv]. The report calculates that its green program will generate 2 million year-long jobs, and if they are the right types, the 800,000 construction workers will fill some of them, along with 1.2 million others. The study sees no costs of job transfer because recent data tell us that 8 million people will still be unemployed. This might be the case if the unemployed were a large stagnant pool, but they are not.
Workers change jobs and enter or leave the labor market at surprisingly high rates, and employers originate and close job slots with similar speed. In a typical quarter between 2000 and 2005, over 9 percent of U.S. workers changed employers, entered unemployment, or left the labor force. Another 9 percent were hired from other employers, left unemployment upon finding jobs, or entered the labor force from outside [xv]. Construction workers are more mobile than average. The same quarterly data show that for every 100 construction job slots in existence, approximately 14 new ones open up and another 14 are “destroyed” as projects are completed [xvi]. The project-specific nature of much construction work is one factor responsible for their above-average unemployment rates. Implementing CAP’s green policy will not change this characteristic of the construction industry—workers will simply be retrofitting older buildings instead of building new ones.
The unemployed themselves are a heterogeneous group. In 2007, 7.1 million were unemployed at any one time on average. One million of them were on temporary layoffs with high probabilities of returning to their old jobs [xvii]. Another 2.8 million were either entering the job market for the first time or returning from spells out of the labor force when they were not seeking work. Moreover, 1.1 million were between 16 and 19 years old, many surely living with families and hardly in hardship [xviii]. For the workforce as a whole, in October 2008 the median spell of unemployment was 10.6 weeks, during which many received unemployment compensation [xix]. The unemployment rate fluctuates with general economic conditions. In October 2007 it was 6.5 percent for construction workers (all workers average 4.4 percent) but the subprime crisis and drop in housing construction and deteriorating national economic conditions had brought it up to 10.7 percent in October 2008 [xx]. As of the latter month, the median spell of unemployment for construction workers was 8.8 weeks, two weeks less than the national average [xxi].
In short, the CAP study would have us believe that there is a large, stagnant pool of unemployed workers, who can be tapped to fill new green job slots without reducing output in other industries. But in reality, “the unemployed” is a constantly changing group, and government-created job openings will certainly hamper the private sector’s ability to direct job seekers into the most productive outlets.
D. Domestic Content
Economists disagree on many things, but the one area of consensus is that free trade raises living standards for all countries. Yet the CAP study contends that its green program is additionally desirable because a high proportion of the payouts will be spent on domestically produced goods, whose manufacture increases domestic employment:
The green investment program relies much more on products and services made within the U.S. economy and less on imports compared to spending either within the oil industry or on household consumption. These direct and indirect effects on job creation are the most sig¬nificant reason why the green investment stimulus program creates more jobs than a household-consumption stimulus. [CAP, p. 11]
Even on its own terms the CAP analysis doesn’t consider that with a massive new stimulus of $100 billion from the federal government, the green sector may see some of its costs rise, and will turn more and more to foreign imports for some of its key components. There is already a growing volume of international trade in renewables hardware, and the CAP program would amplify the trend [xxii]. There is of course nothing wrong with the renewables industries drawing on the cheapest inputs available, but the trend undercuts one of CAP’s arguments.
To repeat, the goal of energy producers is not to “create American jobs” but to provide energy to consumers at the lowest prices possible. If the energy industry uses some of its earnings to make foreign purchases, this is to contain costs and keep energy prices lower than they otherwise would be.
II. Job Opportunities for the Green Economy, by Pollin and Wicks-Lim (PERI)
As noted in Section I above, both of Pollin’s papers (CAP and PERI) are built around a policy that will allocate $100 billion from the federal government among six “green economy” strategies: retrofits to buildings, expansion of mass transit, building a “smart” electric grid that allows better management of production and consumption, expanding wind power, expanding solar power, and promoting research in “next generation” biofuels [xxiii]. In the previous section, we discussed various shortcomings in the CAP analysis, touting the alleged benefits of this program. In the present section, we focus on an issue unique to the PERI study.
The job-creation strategies recommended in CAP and PERI can only work if a sufficient number of workers with the requisite skills are available. The PERI study seeks to demonstrate that the relevant workers really are available to fill the millions of newly-created green positions. The PERI authors use input-output tables and occupational statistics to choose ten “representative jobs.” For example, wind farms require sheet metal workers, biofuels require chemists, and both require industrial truck drivers. PERI then examines the availability of people qualified for these jobs in each of 12 states. Using data on the numbers in each state employed in each type of job, the study concludes that the requisite skills to carry out its program are currently available.
Although it is less clear in PERI, the CAP study makes clear that “job creation” means that the chosen policy will reduce unemployment rather than take already-employed workers from their positions. If so, the data employed in PERI are thoroughly inappropriate. To see if the newly created jobs can be filled, instead of counting the employed the PERI study should have determined how many qualified people are unemployed. If there are 1,000 machinists in the state and 95 percent of them are employed, there are only 50 people who matter for (net) job creation. If an employed person changes to a green employer and no unemployed are available, his or her previous output is lost – one job has been created and another lost. PERI presents no data on whether the state’s unemployed population have characteristics that would allow them to quickly fill new jobs, many of which appear to require dedicated education or substantial training.
The PERI study fails to note that the skilled workers who are important to its findings generally have lower unemployment rates than the average for the labor force as a whole. In October 2008 the national unemployment rate was 6.1 percent, but “Managerial, Professional, and Technical” workers had an overall unemployment rate of 3.0 percent [xxiv]. The highest occupational unemployment rate was 10.1 percent for construction workers, a consequence of the past year’s collapse of homebuilding. In general, however, the “good jobs” are those with low turnover that have smaller numbers of unemployed. This means that federal efforts to create high-paying jobs will likely fill many of the new positions from the pool of already-employed workers, rather than drawing entirely from the ranks of unemployed workers.
III. U.S. Conference of Mayors, Current and Potential Green Jobs in the U.S. Economy,by Global Insight
A. How to Categorize Green Jobs?
This study and the next (ASES) attempt to estimate long-term employment in growing markets for renewable power and energy efficiency. While PERI and CAP looked at the effects of a single spending injection, these studies examine the jobs created by longer lasting green policies. Any estimates will depend on which particular workers and products are classed as green, and there are no clear boundaries between green and non-green. This arbitrariness allows researchers to choose boundaries that might give their readers quite different impressions about markets. It appears that these two studies are seriously biased toward a vision of large markets with high potentials for growth.
The Conference of Mayors study estimates that there are 751,000 green jobs today. As an example of the problem in defining the boundary between green jobs and ones of a different color, consider the choices of industries and job types to include in “renewable power generation,” an activity that bridges several standardized federal classifications. The study’s authors used a proprietary database to estimate 127,000 jobs in this area—a figure that appears quite high, but one that readers without access to the data cannot analyze. We can, however, conclude that the researchers probably created an overly high figure on several grounds. First, unlike most other studies, this one defined large hydroelectric and nuclear facilities as renewable alongside the more usual wind, biomass, geothermal and solar resources [xxv]. In 2006, nuclear units provided 19.3 percent of the nation’s power and hydroelectric facilities produced 7.1 percent. In contrast, the narrower class of renewables produced only 2.4 percent of the nation’s power [xxvi]. As defined in the study, “renewable” power output is twelve times greater than that of generators customarily defined as renewable by most environmental advocates. If so, considerably fewer than 127,000 workers currently hold jobs associated with non-hydro and non-nuclear renewables.
Other data in the study are also hard to interpret. The study claims that over half of those employed in green jobs (in the combined renewable and efficiency areas) held engineering, legal, research and consulting positions, a seemingly high figure that apparently does not include managers and supervisors. Lacking access to Global Insight’s database, we cannot further check their calculations or comment on the reasonableness of such numbers.
B. Productivity and Employment
As best can be determined, none of the four studies attempts to account for growth in worker productivity. This means that if output of a certain industry doubles, these studies assume that employment will do likewise. In reality, workers everywhere in the economy become more productive with the passage of time – their formal education continues to increase, they accumulate experience on the job, and they have more productive technologies to work with. Adjusting for expected productivity increases dramatically lowers the employment potential calculated in studies like these. A consensus estimate is that worker productivity in the U.S. has increased on average by 2 percent per year since 1970 [xxvii]. The compound growth of productivity means that a worker in 2038 will be the equivalent of 1.81 workers in 2008. If productivity does not increase, the Council of Mayors study projects a growth in green jobs from 750,000 today to 4.2 million in 2038. If we adjust for productivity growth, the planned 2038 outputs of renewable power, retrofits, etc. will require only 2.3 million workers rather than the 4.2 million that the study forecasts.
C. Renewable Generation: Performance and Potential
After broadly defining the renewable industry, the Council of Mayors study goes on to paint a picture of expanding markets that can only grow further. In reality, with the single exception of wind, U.S. power production from renewables has stagnated for the past fifteen years. Table 1 below shows that the total output of wood burning, waste burning, geothermal and solar power plants fell from 73.0 billion kilowatt hours (twh) in 1994 to 69.8 in 2007 [xxviii].
U.S. Power Generated by (non-Hydro) Renewables, 1994 and 2007
| 1994 production (twh) | 2007 production (twh) | |
| Wood | 37.9 | 38.6 |
| Waste | 19.1 | 16.1 |
| Geothermal | 15.5 | 14.6 |
| Solar | 0.5 | 0.5 |
| Wind | 3.4 | 26.6 |
| Total, Excluding Wind | 73.0 | 69.8 |
| Total, non-Hydro Renewables | 76.5 | 103.0 |
| Total, ALL SOURCES | 3,247.5 | 4,159.5 |
Source: U.S. Energy Information Administration, Electric Power Monthly (Aug. 2008) Net Generation by Other Renewables: Total, at http://www.eia.doe.gov/cneaf/electricity/epm/table1_1_a.html
The seemingly impressive growth figures that appear in the Council of Mayors study reflect careful choices of data rather than meaningful trends. For example, on page 7 the study enthuses about a 23% increase in solar output between 2000 and 2007, which equates to 2.95 percent per year. Electricity generated from solar sources (photovoltaic plus thermal) equaled .0145 percent of total power, which grew at 1.28 percent per year in the same period. If its noted recent rates of growth persist, solar will produce 1 percent of the nation’s power supply by the year 2261 [xxix].
The failure of all renewables (other than wind) to expand from 1994 to 2007 occurred in the face of increasing political pressures to build renewables for the mitigation of climate change, including laws in over half the states that require utilities to invest in renewables. Indeed, the growth of wind power is largely an artifact of its favorable tax treatment rather than its economic viability. Wind turbines receive a federal production tax credit, currently 2 cents per kilowatt-hour, accelerated depreciation and additional benefits in some states. Investment in wind turbines has dropped by 75 percent or more in periods when a federal production tax credit lapsed [xxx]. After massive infusions of research and development funding, renewables remain the economic choice only in special situations. Renewables have environmental impacts of their own, and residents in numerous localities are coming to resist them as they already resist the siting of conventional powerplants near them. The growth of a renewables industry is far from guaranteed, and there are no known official projections that match the expected growth figures in the Council of Mayors study.
The document contains other misleading statements about the performance of renewables. With the exceptions of geothermal and hydro power, renewables are intermittent, e.g. solar units only produce when the sun is shining and wind units when the wind is blowing. Reliability requires additional investments in a full scale power grid and conventional generation. Thus the claim on page 6 that “wind generation in 2007 was enough to power more than 2.9 million homes” is misleading. Even though the total power generated by wind was equal to the total power used by 2.9 million households, it is not true that wind alone could have powered them, because of its intermittent nature.
IV. American Solar Energy Society, Renewable Energy and Energy Efficiency: Economic Drivers for the 21st Century (ASES)
A. Definitional Differences
With no standardized definitions of the renewable and energy efficiency industries, authors of reports like these have a wide range of plausible choices. The Conference of Mayors calculated 751,000 jobs in the two industries today [xxxi]. ASES chose a far more expansive definition, and also provided figures on both direct jobs and indirect ones created by the input purchases of directly funded employers. It estimated 193,550 direct workers in renewable energy, 50 percent more than the Council of Mayors assumed under its own expansive definition of renewables. Both include workers in retrofits and directly related manufactures, e.g. insulation, in their definitions of the efficiency industry. ASES, however, includes jobs in the building of cars that exceed federal fuel economy standards by 10 percent or more, as well as appliances, computers and HVAC equipment that meets Energy Star or similar standards. Definitions like these yield a total of 3.5 million direct jobs in efficiency today, and 8.0 million direct and indirect [xxxii]. To see the arbitrariness, note that ASES’ estimate of today’s total jobs in the efficiency industry is 2.7 times the number of efficiency jobs the Council of Mayors projects for 2038 [xxxiii].
Unllike the Council of Mayors, ASES provides three growth scenarios but does not state their assumptions in detail. There is a “base case” in which laws and technology change little from today, a “moderate scenario” and an “advanced scenario” with legal and technological innovations that strongly favor renewables [xxxiv]. The base case brings forth 16.3 million direct and indirect jobs by 2030, and the advanced scenario 40.1 million. Like all of the other studies, it does not net out any employment lost as opportunities in the conventional power industry vanish and as industries that produce energy-intensive goods shrink due to higher energy costs rippling through the economy. Extrapolating from available data, the study estimates that renewables and efficiency will directly employ 17.4 million workers in 2030 in the advanced scenario [xxxv]. In a projected labor force of 180 million, fully 10 percent will be directly employed in renewables and efficiency.
B. The Implications of Job Creation
The larger the percentage of the workforce engaged in producing renewable power and efficiency, the smaller will be the output of other goods. The ASES study appears to argue that growth in renewable and efficiency workers is in itself desirable, but it is hard to see why if this shrinks the workforce available to produce other valuable goods and services. ASES and the Council of Mayors say nothing about where these workers will come from and how the change will affect the well-being of consumers.
The fact that building and operating renewable power generators requires more labor time than for conventional generators is a signal that the nation should not rush toward renewables in the haste that so many are urging today. If a megawatt of solar capacity requires four times the workers as a megawatt of coal-fired power, building the solar plant makes the nation poorer, other things equal [xxxvi]. The public is worse off because it sacrifices the outputs that those workers could have produced had they been employed elsewhere. The people purchasing the solar power enjoy a lower standard of living than was necessary.
Solar power is expensive, but may have environmental virtues that conventional power does not. The way to make a case for it is to compare its environmental attributes and its cost, which will be higher if more workers are required to build it. All of these studies implicitly argue in favor of renewables and efficiency improvements because building them creates job slots that conventional power does not. But this confuses mere job creation per se with the more important goal of creating high value-added jobs that efficiently use scarce labor resources to produce the most valuable output possible. Other things equal, it is a vice, not a virtue, if one production technique requires more labor hours to produce the same amount of energy. Indeed, it is precisely because of their higher costs that alternative sources currently do not pass the market test, and cannot compete without government assistance.
[i] Robert Pollin et al., Green Recovery: A Program to Create Good Jobs and Start Building a Low-Carbon Economy, Center for American Progress, Washington D.C., Sept. 2008. Cited in text as “CAP.”
[ii] Robert Pollin and Jeannette Wicks-Lim, Job Opportunities for the Green Economy: A State-by-State Picture of Occupations that Gain from Green Investments, Political Economy Research Institute, University of Massachusetts, Amherst, June 2008. Cited in text as “PERI.”
[iii] U.S. Conference of Mayors, Current and Potential Green Jobs in the U.S. Economy, prepared by Global Insight, Oct. 2008. Cited as “Conference of Mayors.”
[iv] American Solar Energy Society, Renewable Energy and Energy Efficiency: Economic Drivers for the 21st Century, prepared by Management Information Services, Inc., 2007. Cited as “ASES.”
[v] CAP p. 3.
[vi] CAP p. 12.
[vii] EIA, “Federal Financial Interventions and Subsidies in Energy Markets 2007” (April 2008), Table ES5, page xvi, available at: http://www.eia.doe.gov/oiaf/servicerpt/subsidy2/index.html.
[viii] ASES p. 46.
[ix] ASES p. 51.
[x] PERI p. 3.
[xi] CAP p. 15. He provides no citations for the dollar amounts.
[xii] CAP p. 20.
[xiii] CAP p. 22.
[xiv] CAP pp. 12-13.
[xv] Steven Davis et al, “The Flow Approach to Labor Markets: New Data Services and Micro-Macro Links,” Journal of Economic Perspectives 20 (Sum. 2006) 3-26, p. 6.
[xvi] Ibid p. 8.
[xvii] Lawrence Katz and Bruce Meyer, “Unemployment Insurance, Recall Expectations, and Unemployment Outcomes,”Quarterly Journal of Economics 105 (Nov., 1990), 973-1002.
[xviii] U.S. Bureau of Labor Statistics, Current Population Survey Table A-27 (Nov. 2008), at http://www.bls.gov/cps/cpsaat27.pdf.
[xix] U.S. Bureau of Labor Statistics, Economic News Release, Table A-9 (Nov. 2008), at http://www.bls.gov/news.release/empsit.t09.htm.
[xx] U.S. Bureau of Labor Statistics, Economic News Release, Table A-10 (Nov. 2008), at http://www.bls.gov/news.release/empsit.t10.htm.
[xxi] U.S. Bureau of Labor Statistics, Current Population Survey Table A-37 (Nov. 2008), at http://www.bls.gov/web/cpseea37.pdf.
[xxii] International trade in renewable hardware is large and increasing. General Electric is the only important US producer of wind turbines, and its share of the domestic market fell from 59 to 44 percent between 2005 and 2007. U.S. Department of Energy, Annual Report on U.S. Wind Power Installation, Cost, and Performance Trends 2007 at 10. China is rapidly increasing its production of photovoltaics for both domestic use and exports.
[xxiii] PERI p. 3.
[xxiv] Engineers, architects, and legal occupations (all important in some job creation studies) were slightly higher, at 3.7 percent. U.S. Bureau of Labor Statistics, Current Population Survey, Table A-30, at http://www.bls.gov/web/cpseea30.pdf.
[xxv] Conference of Mayors, p. 5.
[xxvi] U.S. Energy Information Administration, Electric Power Annual 2007. http://www.eia.doe.gov/cneaf/electricity/epa/epat1p1.html.
[xxvii] See U.S. Energy Information Administration, Outlook for Labor Productivity Growth 2004, at http://www.eia.doe.gov/oiaf/archive/aeo04/issues.html.
[xxviii] U.S. Energy Information Administration, Electric Power Monthly (Aug.. 2008) Net Generation by Other Renewables: Total, at http://www.eia.doe.gov/cneaf/electricity/epm/table1_1_a.html.
[xxix] Even at their 2006 – 2007 growth rates (Solar 19.23%, All power 2.33%), solar becomes 1 percent of total power generated in 2033. Data are from U.S. Energy Information Administration, Electric Power Monthly (Aug. 2008), Net Generation by Energy Source: Total (All Sectors) at http://www.eia.doe.gov/cneaf/electricity/epm/table1_1.html and Net Generation by Other Renewables: Total (All Sectors) at http://www.eia.doe.gov/cneaf/electricity/epm/table1_1_a.html.
[xxx] Ryan Wiser et al, Using the Federal Production Tax Credit to Build a Durable Market for Wind Power in the United States, Lawrence Berkeley National Laboratory LBNL-63583 (2007) at 3. http://eetd.lbl.gov/ea/emp/reports/63583.pdf.
[xxxi] Conference of Mayors, p. 5.
[xxxii] ASES p. 31.
[xxxiii] The Council of Mayors number (at 17) is the total (4.2 million) less renewable power generation (1.2 million).
[xxxiv] ASES p. 39.
[xxxv] ASES does not split its projections into direct and indirect jobs. Today, however, they estimate direct jobs at 43 percent of the total. ASES p. 31.
[xxxvi] These are the numbers assumed by Daniel Kammen et al, Putting Renewables to Work: How Many Jobs Can the Clean Energy Industry Generate?” University of California Berkeley Renewable and Appropriate Energy Laboratory, 2004 at 10. http://rael.berkeley.edu/files/2004/Kammen-Renewable-Jobs-2004.pdf.
