
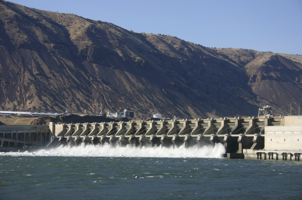
Most hydroelectric power comes from dammed water driving a water turbine and generator. The amount of energy extracted from the moving water depends on the volume of water and on the difference in height between the water’s source and outflow.
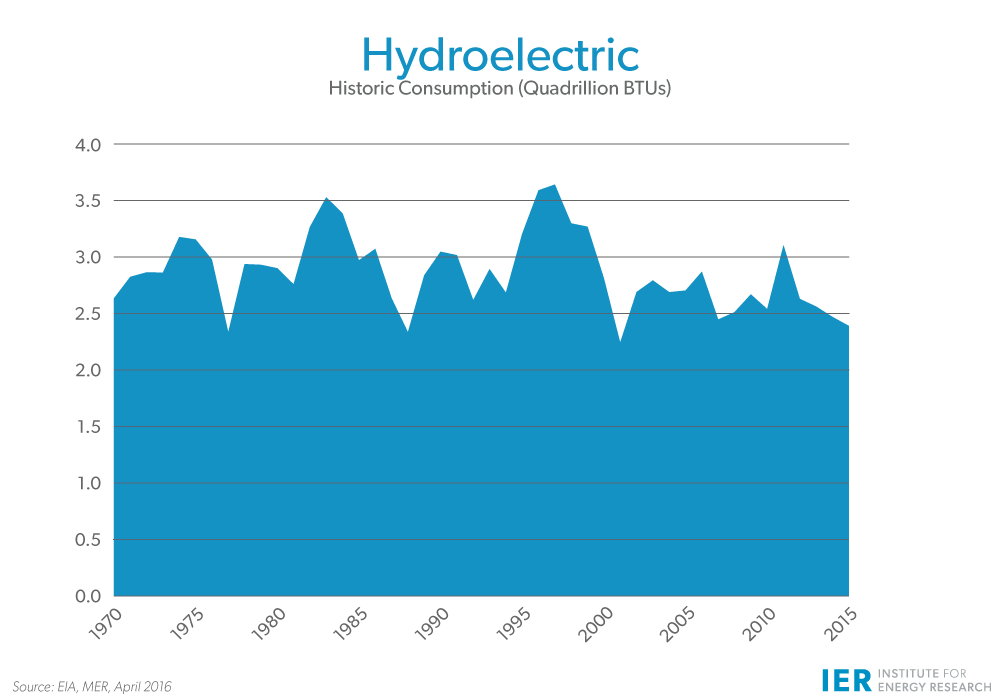
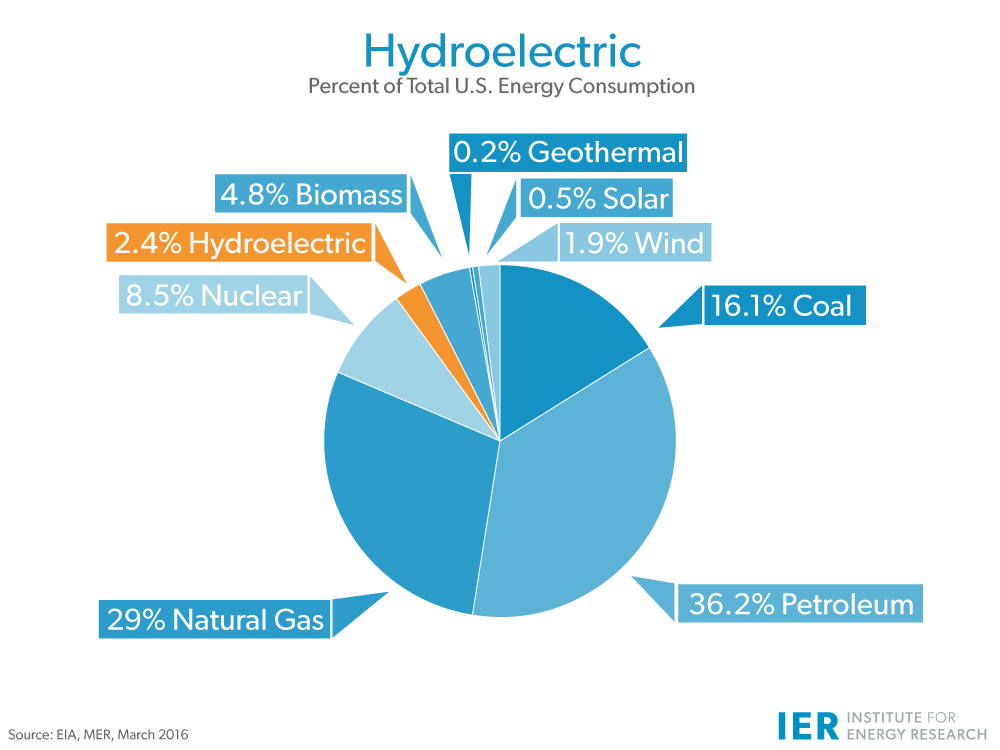
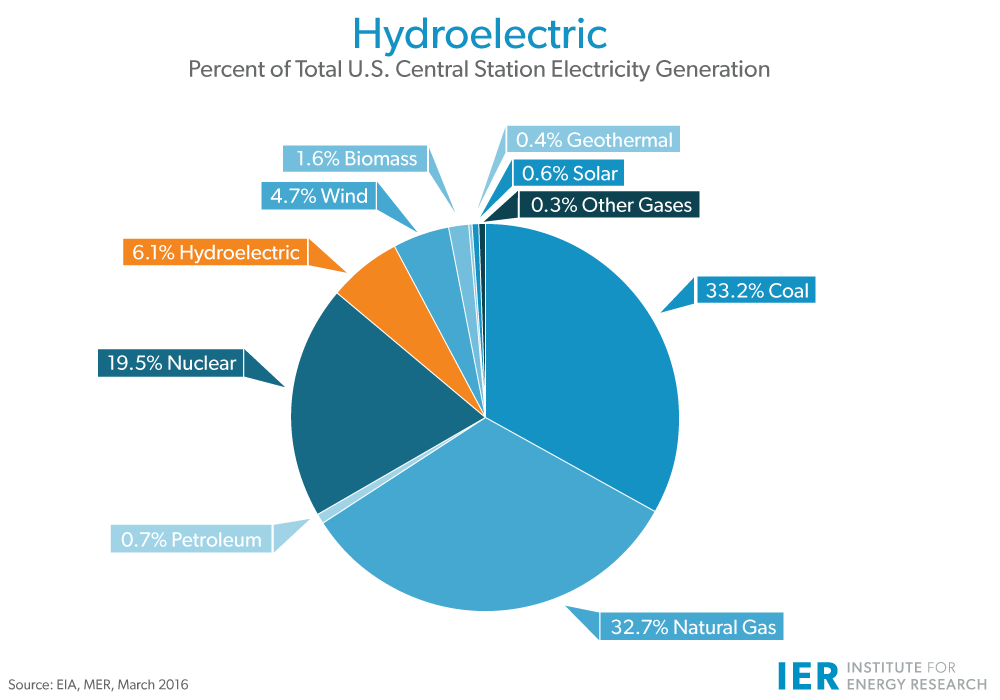
In 2015, hydropower represented 2.4 percent of the total energy consumed in the United States—lower than the level it reached in 2014.[i] Hydroelectricity is dependent on the amount of participation and will vary somewhat over time as is illustrated in the graph below. In 2015, renewable energy accounted for 13 percent of the total net electricity generated in the United States [ii]. Hydropower accounted for 46 percent of that total.
The states with the largest hydroelectric generation are Washington, California, New York, Oregon and Alabama.
The major advantage of hydropower is the virtual elimination of the cost of fuel. With flowing water as their power source, hydroelectric plants are practically immune to increases in the cost of fossil fuels. Also, hydropower produces no emissions into the air, including emissions of carbon dioxide (CO2.)
However, while it is both a clean and renewable source, the potential for the production of more energy from hydropower is significantly limited because of opposition from opponents of hydroelectric power.
Most dam construction projects in the world today are being undertaken in those nations hungry for the economic growth that new energy supplies fuel. In much of the world already made comfortable by substantial energy use, opposition to the renewable energy provided by dams has grown as some see environmental concerns and leisure as more important than the work made possible by new energy supplies.
[i] Energy Information Administration, Monthly Energy Review, March 2016, Table 1.3, http://www.eia.gov/
[ii] Energy Information Administration, Monthly Energy Review, March 2016, Table 7.2a, http://www.eia.gov/totalenergy/data/monthly/pdf/sec7_5.pdf