
According to the Energy Information Administration, “renewable energy refers to resources that are replenished in a relatively short period of time.” Renewable energy sources include hydropower, wood biomass (used to generate heat and electricity), alternative biomass fuels (such as ethanol and biodiesel), waste, geothermal, wind, and solar.

The use of renewable fuels dates to Neolithic times, when cave dwellers made fire from wood and other biomass for cooking and heating. For thousands of years thereafter, renewable energy was all humans used. The small amounts of energy accessible to humans through traditional dispersed renewable energy sources meant that for millennia, human lives remained unchanged. Today, many are seeking to use technology made possible by modern, concentrated energy forms to capture and harness dispersed renewable energy potential into concentrated forms. Renewable energy relies upon the natural forces at work upon the earth, including the internal heat represented by geothermal, the pull of lunar gravity as it affects the potential for tidal power, and solar radiation such as that stored through photosynthesis in biomass.
Renewable Energy in the US
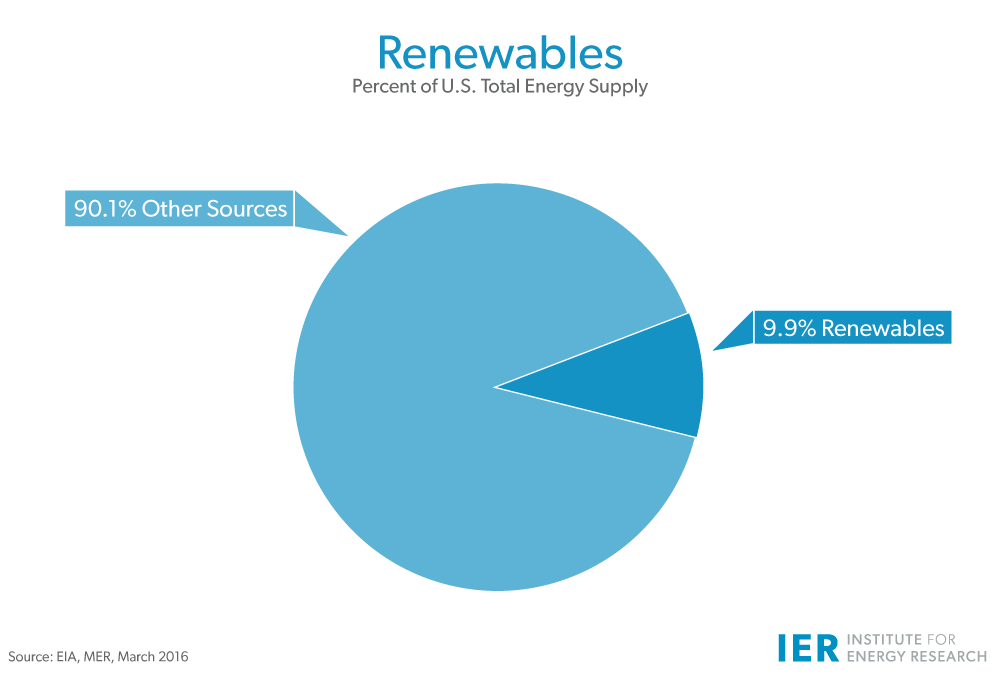
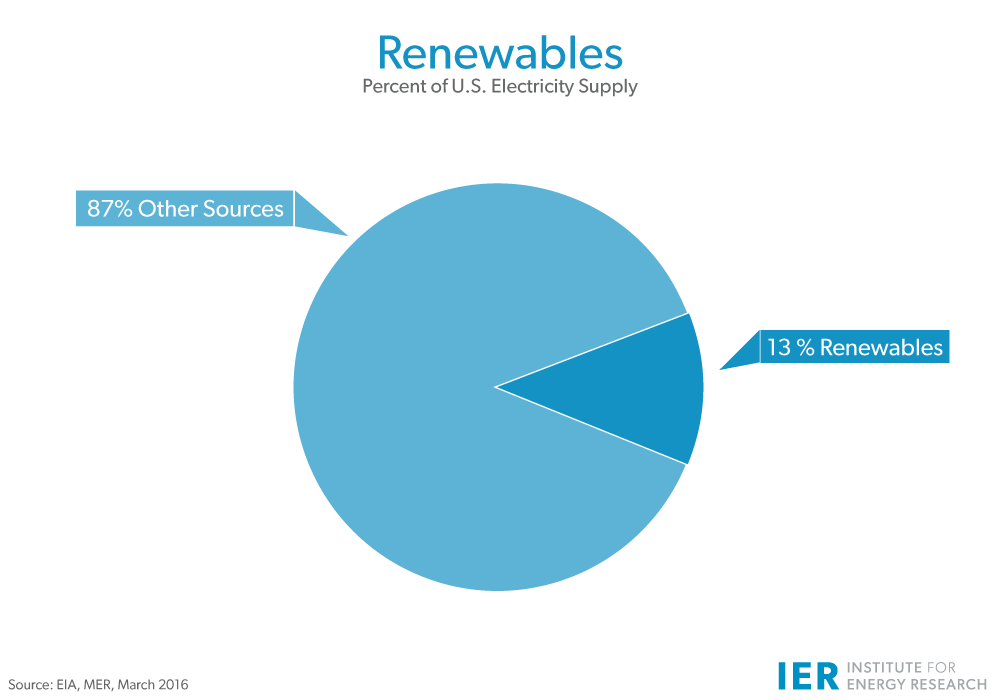
About 9.9 percent of all energy consumed in the United States in 2015 was from renewable sources[i], and they account for about 13.4 percent of the nation’s total electricity production[ii].
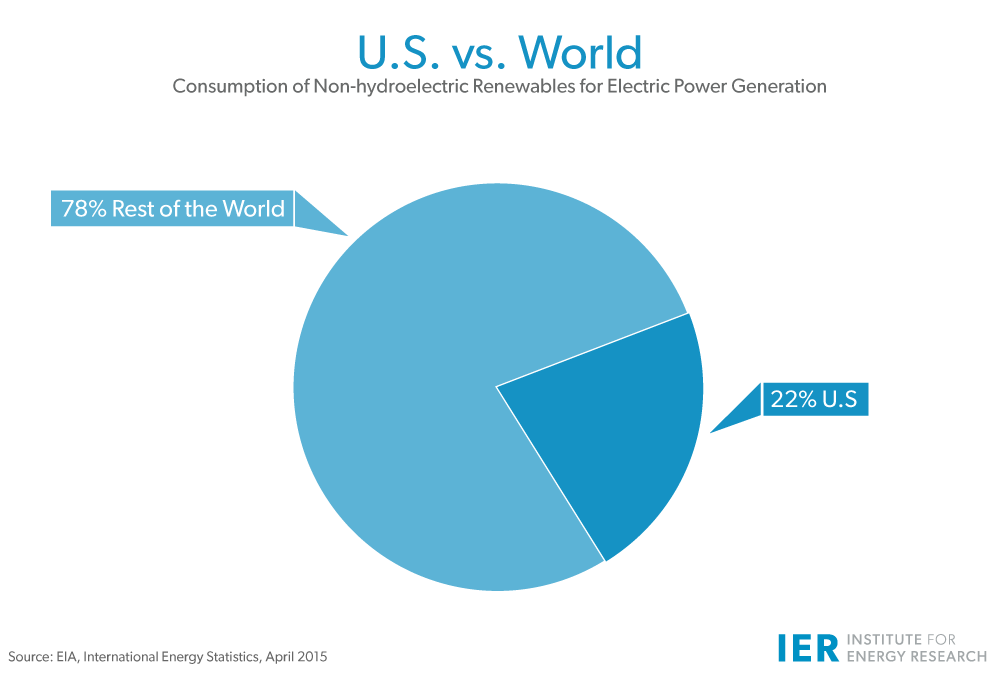
While a relatively small fraction of our overall energy supply in 2012 (the most recent data from the Energy Information Administration), the United States was the world’s largest consumer of renewable energy from geothermal, solar, wood, wind, and waste for electric power generation producing 22% of the world’s total. In 2015, the distribution of U.S. renewable consumption by source was [iii]:
- Hydropower 25%
- Biomass Wood 21%
- Biomass Waste 5%
- Biomass Biofuels 22%
- Wind 19%
- Geothermal 2%
- Solar 5%
While hydropower is the biggest source of renewable energy in the United States, geothermal power is the smallest, accounting for about 0.4 percent of the net electricity produced in the United States in 2015[iv]. Globally, the use of hydroelectricity and other grid-connected renewable energy sources is expected to grow slowly over the next couple of decades, increasing at a rate of 2.5 percent per year until 2040, according to the Energy Information Administration (EIA)[v]. Most of that growth will come from the construction of new hydropower and wind generating facilities. The renewable share of total world energy consumption is expected to rise from 10.6 percent in 2009 to 14.5 percent in 2040[vi].
Renewable Obstacles
One of the most significant obstacles to making most renewable energy sources competitive with more widely adopted energy sources is that they are relatively dilute. In fact, some of today’s more promising processes for tapping biomass energy involve using chemical or thermal conversion in an attempt to mimic the results of a process that, through immense pressure and over geologic time scales, created energy-rich fossil fuels from biomass. Despite such developing technologies, the amount of energy in a given amount of raw biomass tends to be significantly less than that contained in an equal amount of its concentrated cousin, fossil energy. In the United States, demand for all sources of energy is expected to rise between now and 2040 to keep pace with growth in the economy, population and standard of living. Renewable sources are anticipated to participate more broadly in this growth being spurred by State and Federal legislation, including the Energy Independence and Security Act of 2007.
In 2015, hydropower accounted for 2.39 quadrillion Btu of energy [vii], a figure the EIA expects to grow slightly through 2040[viii]. All other sources of renewable fuels accounted for 7.29 quadrillion Btu in 2015[ix] and are anticipated to increase to 9.71 quadrillion Btu by 2040[x]. The increase is due to the Federal Renewable Fuel Standard, mandating the use of ethanol in transportation fuels, state Renewable Portfolio Standards, mandating the use of renewable generating technologies in the electric sector of 30 states and the District of Columbia, the Emergency Economic Stabilization Act of 2008, and the American Recovery and Reinvestment Act of 2009 among other legislation. Of the 105.7 quadrillion Btu the U.S. is expected to consume in 2040[xi], renewable sources are projected to account for 12.52 quadrillion Btu, or 11.8 percent [xii].
[i] Energy Information Administration, Monthly Energy Review, March, Table 1.3, http://www.eia.gov/totalenergy/data/monthly/pdf/sec1_7.pdf .
[ii] Energy Information Administration, Monthly Energy Review, March 2016, Table 7.2a, http://www.eia.gov/totalenergy/data/monthly/pdf/sec7_5.pdf .
[iii] Energy Information Administration, Monthly Energy Review, March 2016, Table 10.1, http://www.eia.gov/totalenergy/data/monthly/pdf/sec10_3.pdf .
[iv] Energy Information Administration, Monthly Energy Review, March 2016, Table 7.2a, http://www.eia.gov/totalenergy/data/monthly/pdf/sec7_5.pdf .
[v] Energy Information Administration, International Energy Outlook 2013, Table A9, http://www.eia.gov/forecasts/archive/ieo13/ .
[vi] Energy Information Administration, International Energy Outlook 2013, Tables A1 and A9, http://www.eia.gov/forecasts/archive/ieo13/ .
[vii] Energy Information Administration, Monthly Energy Review, March 2016, Table
1.3, http://www.eia.gov/totalenergy/data/monthly/pdf/sec1_7.pdf .
[viii] Energy Information Administration, Annual Energy Outlook 2015, Table A1, http://www.eia.gov/forecasts/aeo/pdf/tbla1.pdf
[ix] Energy Information Administration, Monthly Energy Review, March 2016, Table 1.3, http://www.eia.gov/totalenergy/data/monthly/pdf/sec1_7.pdf .
[x] Energy Information Administration, Annual Energy Outlook 2015, Tables A1 and A17, http://www.eia.gov/forecasts/aeo/pdf/tbla17.pdf
[xi] Energy Information Administration, Annual Energy Outlook 2015, Table A1, http://www.eia.gov/forecasts/aeo/pdf/tbla1.pdf
[xii]Energy Information Administration, Annual Energy Outlook 2015, Table A17, http://www.eia.gov/forecasts/aeo/pdf/tbla17.pdf