
Government owned lands and waters are responsible for less and less of the energy produced in the United States. In a recent analysis, the Energy Information Administration (EIA) estimated that production of fossil fuels (coal, oil, and natural gas) on federal lands decreased by 7 percent during fiscal year 2013.[i] Fossil fuels produced on federal lands decreased from 17,230 trillion Btu in FY 2012 to 15,942 trillion Btu in FY 2013. In 2013, even though the federal government is the largest landowner in the country, federal lands produced 25 percent of the fossil fuels produced in America, down from 36 percent a decade ago. While crude oil produced on federal lands increased slightly (by 1 percent) in fiscal year 2013, that increase was more than offset by decreases in coal, natural gas, and natural gas plant liquids (NGLs) production. For example, federal coal production and federal onshore natural gas production each decreased by 9 percent during fiscal year 2013.
Oil
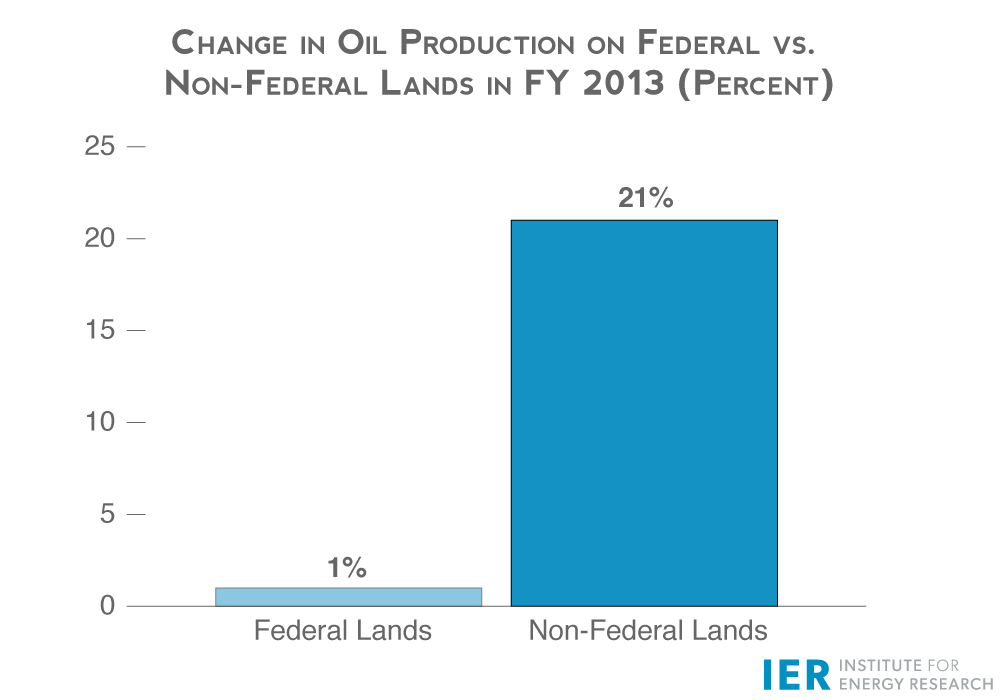
Crude oil produced on federal lands increased by 1 percent in fiscal year 2013 to 606 million barrels, with offshore production decreasing by 1 percent and onshore production increasing by 7 percent, but onshore production represents much smaller volumes. As a share of total oil production, oil production on federal lands dropped to 23 percent in fiscal year 2013 from 26 percent in fiscal year 2012. Oil production on federal lands reduced its share despite increased U.S. production of 15 percent, the majority of which is produced on private and state lands. In fact, oil production on non-federal lands increased by 21 percent in fiscal year 2013.[ii]
Natural Gas
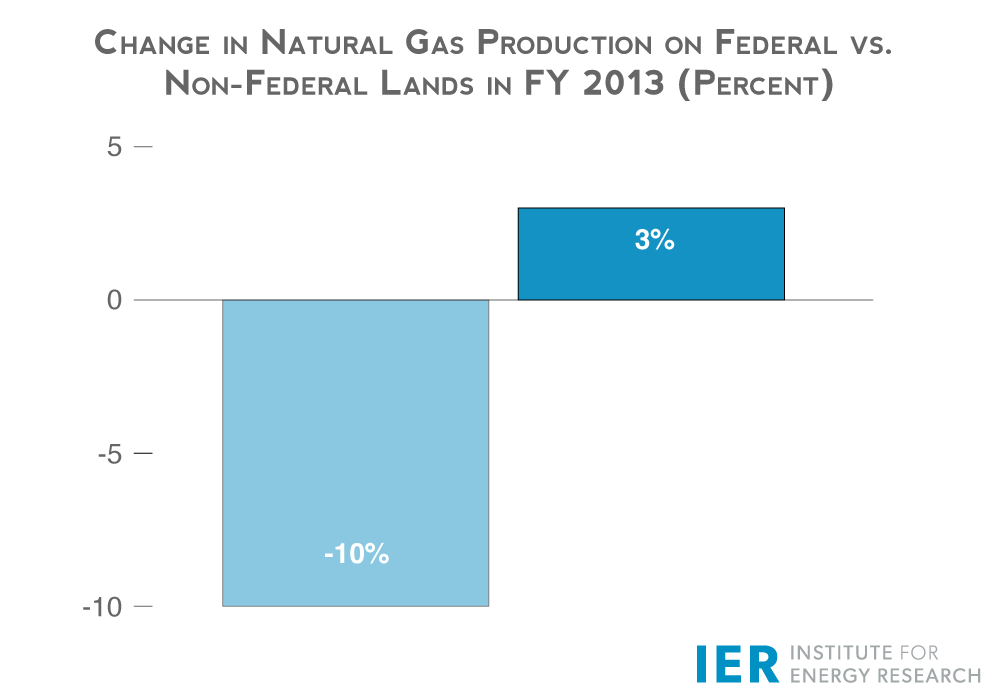
Also seeing a declining share of overall national production is natural gas produced on federal lands, whose share declined from 18 percent in fiscal year 2012 to 16 percent in fiscal year 2013. Natural gas produced on federal lands dropped 10 percent in fiscal year 2013 with just 3,843 billion cubic feet produced—offshore gas production declined 13 percent and onshore production declined 9 percent. In contrast, natural gas produced on state and private lands increased by 3 percent in fiscal year 2013.
Coal
Coal produced on federal lands declined by 9 percent in fiscal year 2013 with 401 million short tons produced. That volume represented a 17 percent reduction from its peak in fiscal year 2008. Coal produced on federal lands accounted for 40 percent of total coal production in fiscal year 2013–a lower share than its 42 percent produced in fiscal year 2012.
Production Trends from Fiscal Year 2003
Fossil fuel production from federal lands declined 21 percent between FY 2003 and FY 2013 due primarily to a steady decline in federal offshore natural gas production since FY 2003 and the 9 percent decline in coal production from federal lands between FY 2012 and FY 2013.
Crude oil
Crude oil production from federal lands decreased 11 percent between FY 2003 and FY 2013 due to reduced production offshore in the Gulf of Mexico that resulted from the moratorium that President Obama placed on offshore production in 2010. Federal offshore production declined by 18 percent between FY 2003 and FY 2013 which outweighed the 33 percent increase in the smaller federal onshore production over the same period.
Natural Gas
Natural gas production from federal lands has dropped 43 percent between FY 2003 and FY 2013. Natural gas produced offshore declined by 74 percent since FY 2003, declining every year through FY 2013. Natural gas produced onshore partially offset the decline by increasing 17 percent over that period. The nation’s share of natural gas produced on federal lands dropped from 36 percent in fiscal year 2003 to 16 percent in fiscal year 2013.
Coal
Due to competition from natural gas at electric power plants and to increasingly onerous EPA regulations, coal production on both federal and private lands has declined over the past 5 years. (See graph below.) Coal production on federal lands declined 17 percent between fiscal year 2008 and fiscal year 2013, while coal production on private lands declined by 12 percent over the same time period.
Production volumes are derived from royalties that companies paid to the Interior Department’s Office of Natural Resources Revenue.
Production Trends by State and Offshore Area
The federal government owns about 650 million acres of land onshore, which is almost 30 percent of the 2.27 billion acres onshore in the United States. (See map below.) Federal land ownership is heavily concentrated in 12 western states—62 percent of Alaska is federally owned and 47 percent of the 11 western states in the Lower 48 are federally owned. Only 4 percent of lands in the other states are federally owned. [iii]
Most of that federal land is administered by four federal agencies—the National Park Service, Fish and Wildlife Service, and Bureau of Land Management (BLM) in the Department of the Interior, and the U.S. Forest Service in the Department of Agriculture. Production of fossil fuels from federal lands primarily is the purview of the BLM, which manages 248 million acres and is responsible for 700 million acres of subsurface mineral resources.
Map of Federal Onshore Lands
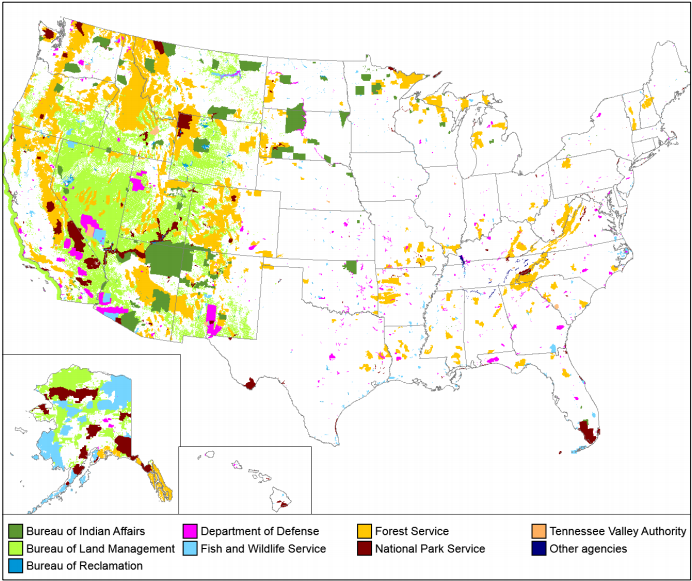
Source: Energy Information Administration, http://www.eia.gov/analysis/requests/federallands/pdf/eia-federallandsales.pdf
The states with the largest production of fossil fuels from federal lands are Wyoming, Montana, Colorado, Utah and New Mexico. Wyoming and the federal Gulf of Mexico together produced 73 percent of the total fossil fuels produced on federal lands in fiscal year 2013. The federal Gulf of Mexico produced 69 percent of federal crude oil production in fiscal year 2013. Oil production from the Bakken formation in North Dakota has been increasing rapidly in recent years, surpassing oil production on federal lands in Wyoming.
Natural gas production on federal lands came primarily from Wyoming, the federal Gulf of Mexico, New Mexico, and Colorado, which together represented 86 percent of the total natural gas produced on federal lands in FY 2013.
Coal production on federal lands is dominated by Wyoming, which accounted for 80 percent of the total in FY 2013. Montana, Colorado, Utah, and New Mexico were the next biggest coal producers on federal lands. Production in Wyoming and Montana has been declining since FY 2009 due to the declining demand for coal.
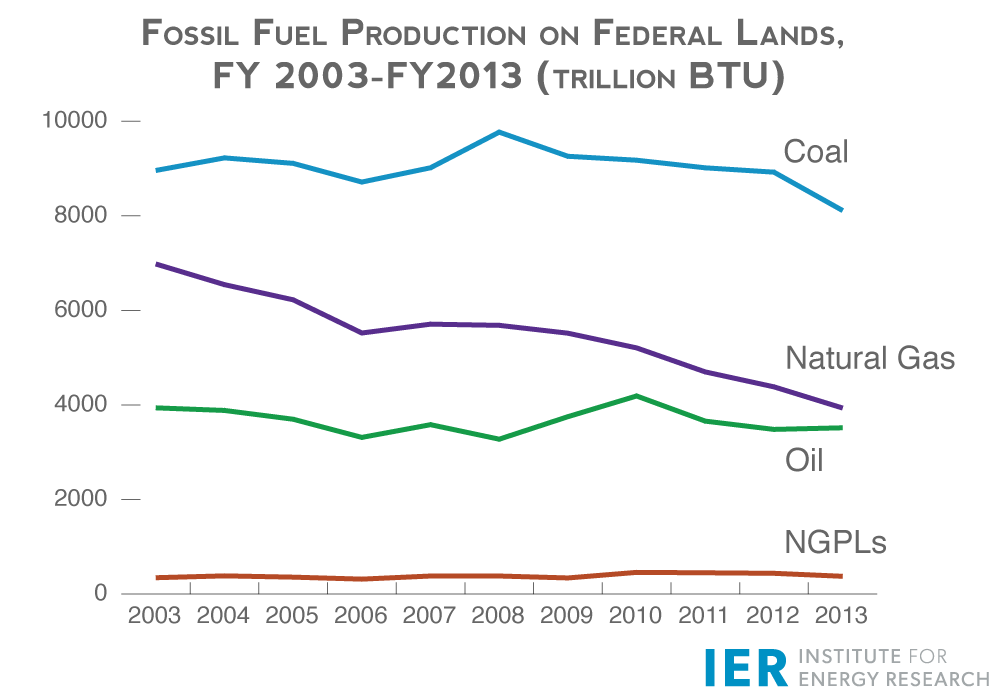
Fossil Fuel Production on Federal Lands
Source: Energy Information Administration, http://www.eia.gov/analysis/requests/federallands/pdf/eia-federallandsales.pdf
Conclusion
Clearly, while President Obama likes to take credit for increasing oil and gas production in the United States, no credit is due him or his administration for the increased production is taking place primarily on private and state lands. The shift of production to non-federal lands is due mainly to more onerous regulations at the Bureau of Land Management and Interior’s offshore bureaus than the regulations that the states impose—the states know the terrain and the needs of their lands better than federal government regulators and work jointly with fossil fuel developers to ensure safe, affordable, and efficient production of fossil fuels.
It is very interesting to note that the federal government owns 1.76 billion acres offshore, making the total government acreage of the mineral estate both onshore and offshore equal to 2.46 billion acres, out of a total 4.03 billion acres, or 61 percent of the total. Yet, fossil fuel production on federal lands is just 25 percent of the total fossil fuels produced in this country—a share that has declined from 36 percent a decade ago.
[i] Energy Information Administration, Sales of Fossil Fuels Produced from Federal and Indian Lands, FY 2003 through FY 2013, June 2014, http://www.eia.gov/analysis/requests/federallands/pdf/eia-federallandsales.pdf
[ii] Congressional Research Service, U.S. Crude Oil and Natural Gas Production in Federal and Non-Federal Areas, April 10, 2014, http://energycommerce.house.gov/sites/republicans.energycommerce.house.gov/files/20140410CRS-US-crude-oil-natural-gas-production-federal-non-federal-areas.pdf
[iii] Congressional Research Service, Federal Land Ownership: Overview and Data, February 8, 2012, http://fas.org/sgp/crs/misc/R42346.pdf
