
At the request of Congress, the Energy Information Administration (EIA), an independent agency of the U.S. Department of Energy, evaluated the amount of subsidies that the federal government provides energy producers for fiscal year 2013, updating a study that it did for fiscal year 2010.[i] Over a 3-year period, from fiscal year 2010 through fiscal year 2013, total federal electricity-related subsidies increased from $11.7 billion to $16.1 billion, an increase of 38 percent over the 3-year period. The largest increases in federal energy subsidies were in electricity-related renewable energy, which increased 54 percent over the 3-year period, from $8.6 billion to $13.2 billion. Total fossil fuel subsidies declined by 15 percent, from $4.0 billion to $3.4 billion. Total federal energy subsidies declined 23 percent, from $38 billion to $29 billion due to the expiration of tax incentives for biofuels, the depletion of stimulus funds, and a decrease in energy assistance funds.
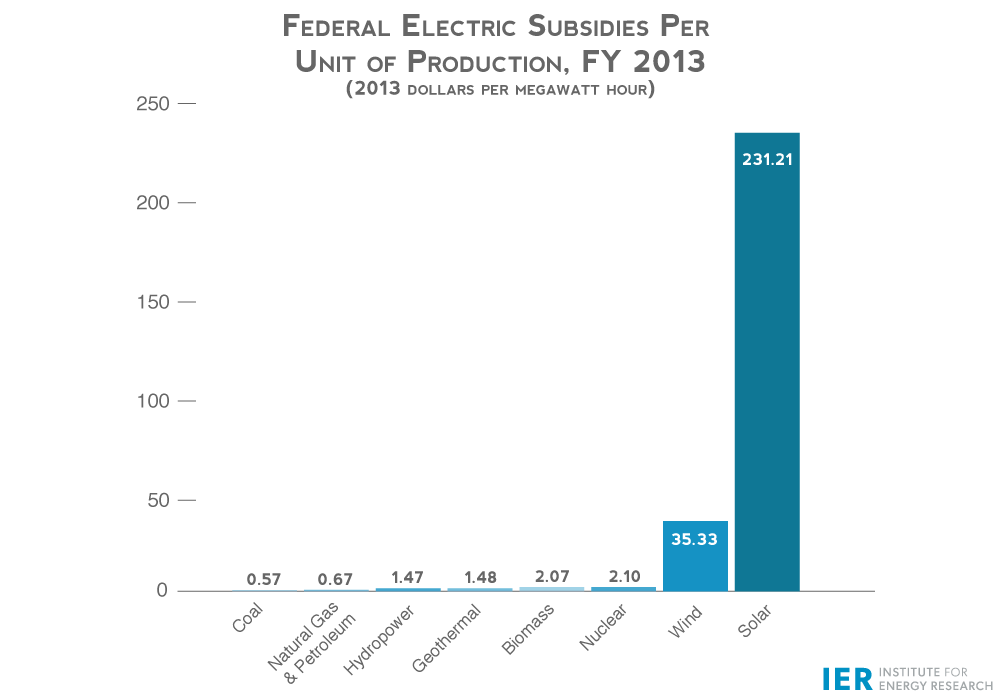
While EIA did not calculate the subsidies per unit of energy produced, the Institute for Energy Research calculated the federal subsidies and support per unit of electricity production from the information provided in EIA’s report. On a per dollar basis, government policies have led to solar generation being subsidized by over 345 times more than coal and oil and natural gas electricity production, and wind is being subsidized over 52 times more than the more conventional fossil fuels on a unit of production basis.
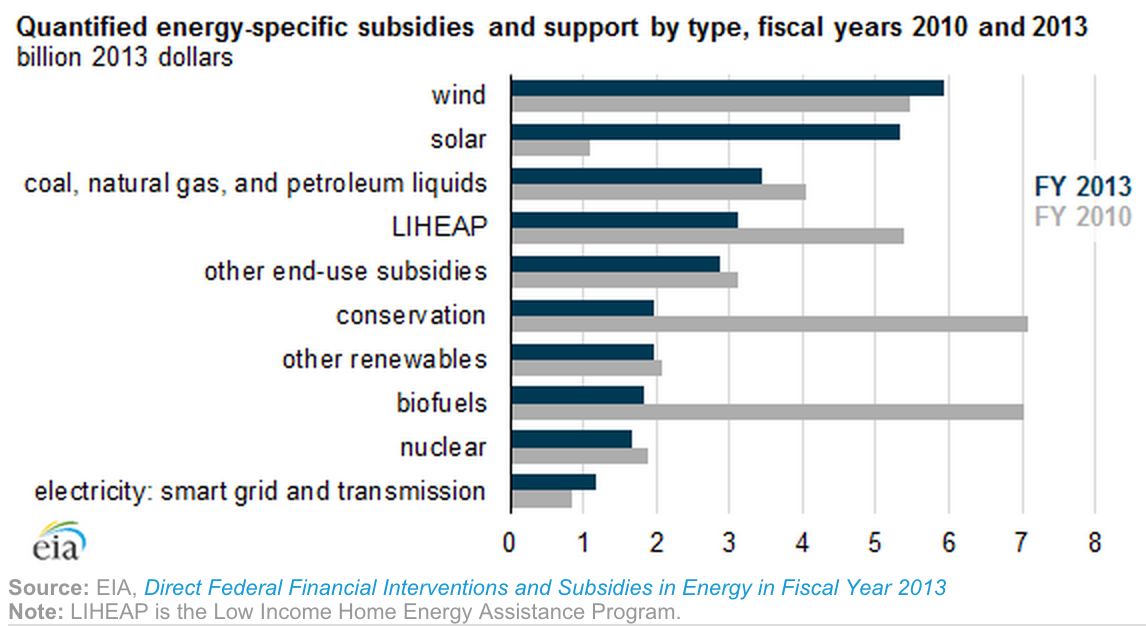
Over the 3-year period, electricity-related renewable subsidies increased, while conservation, end-use, and biofuels subsidies declined:
- Renewable electricity-related subsidies increased by 54 percent from $8.6 billion to $13.2 billion. Electricity-related renewables saw the largest increase in federal benefits. Of the $13.2 billion in fiscal year 2013, $8.6 billion (65 percent) was related to the Obama administration’s economic stimulus law.
- Solar led the various renewables with almost a 5-fold increase in subsidy (both electricity-related and non-electricity related) from $1.1 billion to $5.3 billion and led electricity sector subsidies on a unit of production basis.
- Wind subsidies increased by 9 percent from $5.4 billion to $5.9 billion
- Subsidies for biofuels declined by 74 percent, from $7 billion to $1.8 billion.
- Conservation and end-use subsidies declined by half from $15.6 billion to $7.9 billion. Conservation subsidies declined from $7.1 billion to just under $2 billion (72 percent). End-use subsidies declined from $8.5 billion to just under $6 billion (30 percent).
Over the 3-year period, fossil fuel and nuclear subsidies declined:
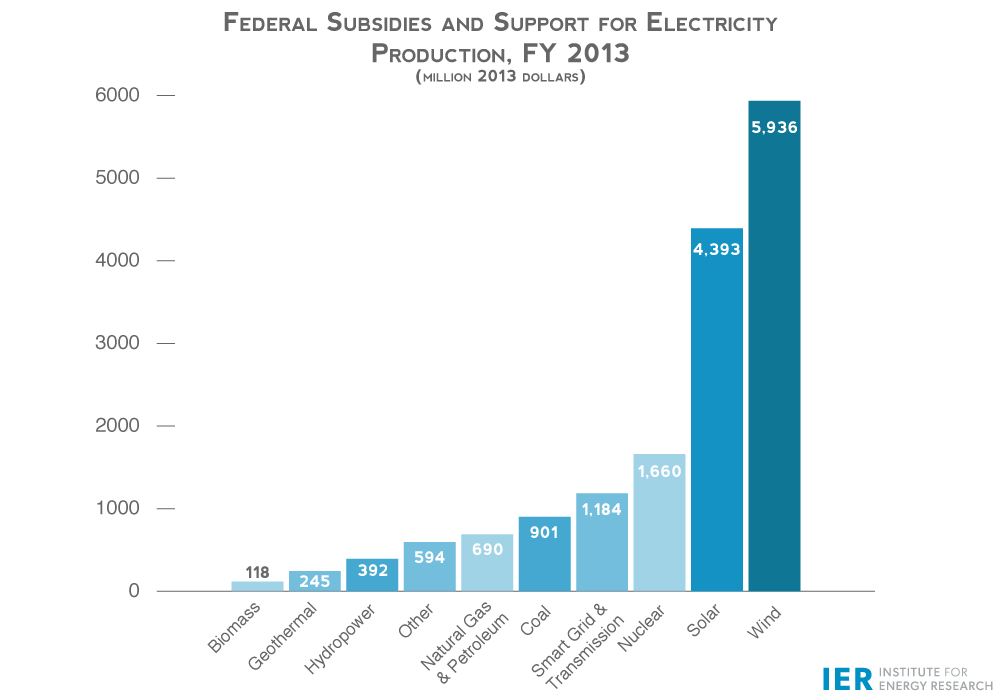
- Federal subsidies for coal declined by almost 3 percent from $1,116 million to $1,085 million.
- Federal subsidies for oil and natural gas declined 20 percent from $2,918 million to $2,346 million.
- Federal subsidies for nuclear energy declined 12 percent from $1,893 million to $1,660 million.
Non Electricity-Related Subsidies
Direct federal financial interventions and subsidies in energy markets declined by almost 25 percent between fiscal years 2010 and 2013, declining from $38.0 billion to $29.3 billion. Conservation and end-use subsidies (excluding LIHEAP) declined in both absolute and percentage terms between fiscal years 2010 and 2013, declining from $10.2 billion to $4.8 billion due to decreases in direct expenditures and tax expenditures. Support for conservation and end use declined by $5.4 billion between fiscal years 2010 and 2013 due to a decline of $2.8 billion in the tax credit for energy efficiency improvements to existing homes (26 U.S.C. 25C) and a decrease of $2.3 billion in direct expenditures supporting conservation subsidies. The ‘25C’ tax credit funded investments in energy-efficient windows, furnaces, boilers, boiler fans, and building envelope components.
Subsidies for fuels used outside the electricity sector declined in both absolute and percentage terms between fiscal years 2010 and 2013, due mainly to the expiration of the Alcohol Fuel Exemption (the Volumetric Ethanol Excise Tax Credit). In fiscal year 2010, ethanol blended with gasoline received a credit of 45 cents per gallon of ethanol used, totaling a tax expenditure of nearly $6 billion. The program expired at the end of 2011.
Subsidies for natural gas and petroleum liquids declined by 20 percent from $2.7 billion in fiscal year 2010 to $2.2 billion in fiscal year 2013. These subsidies are based primarily on tax provisions of the Internal Revenue Code. Tax expenditures related to the excess of percentage over cost depletion for wells declined from $1 billion to $530 million between fiscal years 2010 and 2013, while expensing of exploration and development costs increased from $422 million to $550 million over that period due to increased domestic drilling activities.
Source: EIA, http://www.eia.gov/todayinenergy/detail.cfm?id=20352&src=email
The decline in energy-specific subsidies and support between fiscal years 2010 and FY 2013 does not correspond to the changes in energy consumption and production over that time period. Overall energy consumption was roughly 97 quadrillion British thermal units (Btu) in both fiscal years. Domestic energy production, however, increased 10 percent from 73.7 quadrillion Btu in fiscal year 2010 to 81.1 quadrillion Btu in fiscal year 2013. Oil and natural gas production increased 8 quadrillion Btu, and renewable energy for both electricity generation and transportation uses increased 1 quadrillion Btu. Thus, federal subsidies and support declined as total energy production increased.
According to EIA, no new loan guarantees were issued in fiscal year 2013, and because the subsidy cost of the loans issued in fiscal year 2010, which totaled $1.7 billion, was assessed at the time the loan was issued, there was no subsidy cost for loans in fiscal year 2013. However, there were still outstanding debts in fiscal year 2013 for loans issued in prior years.
Federal Subsidies and Support for Electricity Production
The major focus of the Congressional request is on the calculation of subsidies for electricity generation, which increased by 38 percent between fiscal years 2010 and 2013, from $11.7 billion to $16.1 billion, due to increases in both direct expenditures and tax subsidies. The largest increase was for solar energy that increased its subsidies by $4.2 billion, from $1.1 billion in fiscal year 2010 to $5.3 billion in fiscal year 2013, due to a large increase in the installation rate of solar facilities receiving Section 1603 grant payments or the 30 percent Investment Tax Credit.
Wind energy received the largest share of direct federal subsidies and support in FY 2013, accounting for 37 percent of total electricity-related subsidies. Subsidies to wind energy increased between fiscal years 2010 and 2013 from $5.5 billion to $5.9 billion. Almost three-fourths of FY 2013 wind energy subsidies were direct expenditures and largely resulted from the Section 1603 grant program.
Outlays from Treasury’s Energy Investment Grant program (i.e., Section 1603 grant program for renewable energy) increased from $4.5 billion in fiscal year 2010 to $8.2 billion in fiscal year 2013, and electricity-related tax expenditures for renewable energy doubled from $1.9 billion to $3.8 billion.
Smart Grid and electricity transmission received the largest portion of electricity-related R&D subsidies. Almost 39 percent of fiscal year 2013 R&D expenditures were devoted to researching the electricity grid’s capability to accommodate larger shares of electricity from intermittent sources (e.g., solar, wind, and other renewable energy sources). In fiscal year 2013, electricity-related R&D support totaled $2.1 billion, or 13 percent of the electricity-related value of direct federal financial interventions and subsidies.
 Source: Energy Information Administration, Direct Federal Financial Interventions and Subsidies in Energy in Fiscal Year 2013,
March 2015, http://www.eia.gov/analysis/requests/subsidy/
The EIA report did not account for subsidies by unit of production, although the EIA subsidy report released in 2008 did contain that information.[ii] In the 2015 report, EIA states “… the amount of subsidy per unit of energy produced or consumed does not necessarily provide insight into the current amount of energy production, consumption, or conservation that is or has been supported or influenced. For many programs, there is a disconnect between when the money is spent and when the impacts are felt. For example, many subsidies support capital investments, which may produce little energy in their first year of service (possibly the year a subsidy is claimed), but then produce energy for many years. Also, R&D expenditures are not reflected in the nation’s energy mix unless and until they lead to innovations that penetrate the market, which is a process that could take many years.” While what these statements are meant to imply may be true, the unit of production measure is an indicator of how federal dollars are being used and the value the nation is getting from them.
EIA also states that “Electricity-related renewables received a large share of direct federal subsidies and support in FY 2013 compared with their share of total electricity generation. Renewables (excluding biofuels) received 72 percent of all electricity-related subsidies and support in FY 2013, yet accounted for 13 percent of total generation in calendar year 2013.” While this latter statement is true, the difference is skewed much more than presented by these statistics because hydroelectric power provides the largest share of renewable generation (over 50 percent), but received only 1.4 percent of all subsidies and 2.6 percent of all renewable subsidies.
The Institute for Energy Research calculated the federal subsidies and support per unit of electricity production from the information provided in EIA’s report. The ratio of dollars to production is given in the following figure. As can be seen by the figure, solar generation is being subsidized by over 345 times more than coal and oil and natural gas electricity production, and wind is being subsidized over 52 times more than the more conventional fossil fuels on a unit of production basis.
Source: Energy Information Administration, Direct Federal Financial Interventions and Subsidies in Energy in Fiscal Year 2013,
March 2015, http://www.eia.gov/analysis/requests/subsidy/
Conclusion
EIA’s report shows that on a total dollar basis, wind energy has the highest federal subsidy. However, on a unit of production basis, solar energy is by far the costliest form of electricity production. Both of these technologies are being promoted by the Obama Administration and many environmentalists in lieu of the more cost effective fossil fuels.
According to the Daily Caller, “Green energy subsidies have played a key role in Obama’s efforts to curb U.S. carbon dioxide emissions to build support for an international agreement on global warming. Aside from piling on regulations on fossil fuel combustion, the administration has spent billions of taxpayer dollars to help green energy companies.”[iii]
[i] Energy Information Administration, Direct Federal Financial Interventions and Subsidies in Energy in Fiscal Year 2013, March 2015, http://www.eia.gov/analysis/requests/subsidy/
[ii] Energy Information Administration, Federal Financial Interventions and Subsidies in Energy Markets 2007, April 2008, http://www.eia.gov/oiaf/servicerpt/subsidy2/pdf/execsum.pdf
[iii] Daily Caller, Green Energy Subsidies Double Under Obama, March 13, 2015, http://dailycaller.com/2015/03/13/green-energy-subsidies-double-under-obama/
