
IER recently released a groundbreaking report on the cost of electricity from existing power plants. The report, titled The Levelized Cost of Electricity from Existing Generation Resources, found that electricity from existing power plants is much, much less expensive than from new plants. For example, electricity from existing coal plants is roughly half the price of electricity from new combined cycle natural gas power plants, on average, and only one third the price of electricity from new wind facilities when you consider all of the costs.
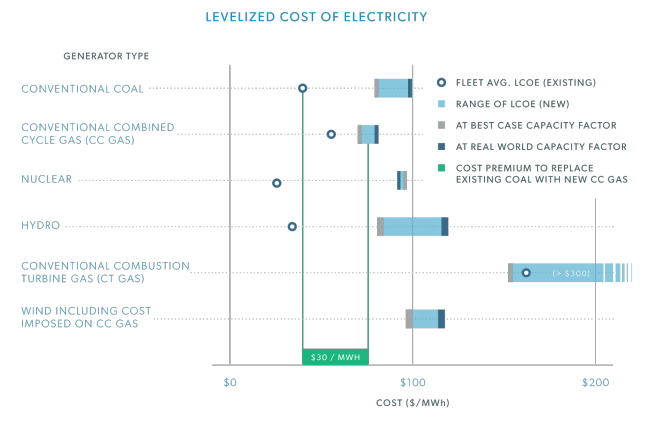
The graphic below summarizes the report’s findings. Note the green lines showing a price premium of $30 per megawatt-hour (MWh) associated with replacing existing coal resources with new natural gas plants. Such a high premium is remarkable because natural gas resources are the least-cost replacement technology.
As we finalized the report, the Energy Information Administration (EIA) released updated figures for its estimates of the LCOE for new resources as part of its Annual Energy Outlook 2015 (AEO 2015). Because our report uses EIA’s estimates to compare the cost of new and existing sources, we updated the relevant tables from the report. Below, the updated Table 1 incorporates EIA’s new data from AEO 2015 along with a brief explanation of the changes to our calculations.
Despite EIA’s lower figures for LCOE in some categories, the takeaways from our report remain the same—electricity from existing sources is a bargain compared to electricity from new sources. The cost increase associated with a transition from existing coal to new natural gas plants is actually higher. Therefore, policies that close power plants before the end of their economic life will inevitably increase the cost of electricity for American families and businesses.
Wind Costs Fall Slightly
Notable changes to Table 1 include a lower estimate for the LCOE New for wind facilities. The lower LCOE New for wind is due to two adjustments in AEO 2015: 1) EIA decreased the capital cost for wind projects by approximately 10 percent to reflect recent trends in the wind industry, and 2) EIA increased the capacity factor for new wind projects by one percentage point.
The end result is a decrease in our adjusted LCOE New for wind generation from $96.2 per MWh down to $88.3 per MWh using a best-case capacity factor, and from $112.8 down to $106.8 per MWh using the fleet-average capacity factor. Still, with existing coal plants generating electricity at $38.4 per MWh, electricity from new wind facilities remains two to three times more expensive.
Lobbyists for the wind industry took issue with our report, calling it an “attack piece” on wind power. We agree that the facts articulated in the report show wind-generated electricity to be an unattractive option, but to call the report an “attack piece” misses the general applicability and fact-based approach of the report.
Of the several critiques of the report offered by the wind lobby, only one is valid: we used EIA data from the Annual Energy Outlook 2014 in our report rather than EIA data from the Annual Energy Outlook 2015. That is because our research for this report began in 2014. Nevertheless, updated Table 1 corrects that minor issue and shows that our central takeaway when it comes to wind power is the same—wind-generated electricity is two to four times more expensive than electricity from existing nuclear, coal, natural gas and hydroelectric resources.
Combined Cycle Natural Gas Costs Increase
A critical finding in our original report is that replacing existing coal-fired generation with that of new combined cycle natural gas units is expensive. It is true that combined cycle natural gas plants produce the least expensive electricity among the new resources we analyzed, but they are markedly expensive relative to existing resources because most of the existing plants have their capital costs already paid.
That cost disparity grew slightly, according to EIA’s updated data. The LCOE New for combined cycle natural gas plants increased from $66.3 to $74, due to EIA’s projected increase in natural gas fuel prices. Table 1 below reflects updated data for all resources.
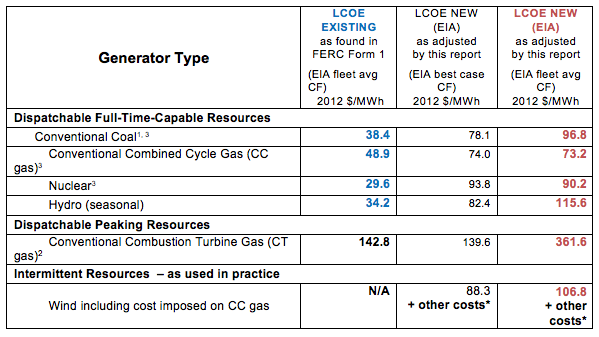
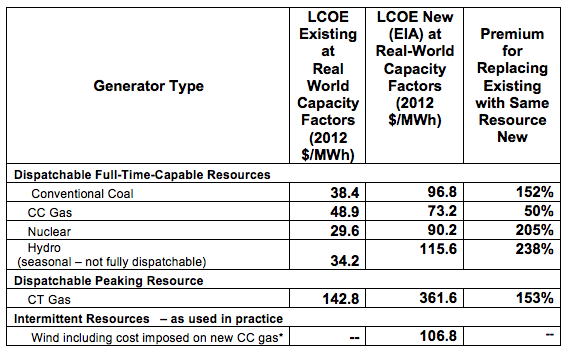
Table 1: Summary of LCOE New versus LCOE Existing
The table below offers a side-by-side comparison of the levelized cost of electricity from existing and new resources. The first column shows the LCOE Existing of different generation sources as calculated using data from EIA and FERC. The second and third columns list the LCOE New of each source under two different scenarios—the best case capacity factor as listed by EIA and the fleet average capacity factor as derived from EIA data. For all sources other than nuclear, the fleet average capacity factor is lower than EIA’s best case, which yields a higher LCOE New under the fleet average scenario.
IER’s recent report, The Levelized Cost of Electricity from Existing Generation Resources, is a fact-based account of the cost of competing electricity resources—the first to compare estimates of LCOE New against our new measure of LCOE Existing. Our update of the report with new data from EIA reflects our continued commitment to using the best real-world estimates available in assessing the costs associated with energy policies.
The report’s findings—that new resources are significantly more costly than existing resources—hold up despite slightly lower estimates of LCOE New for wind resources. The wind lobby may not like our report, but the facts are the facts.
Addendum: Other updated tables from The Levelized Cost of Electricity from Existing Generation Resources
Table 2: Capacity Factors and Fixed Cost Adjustments
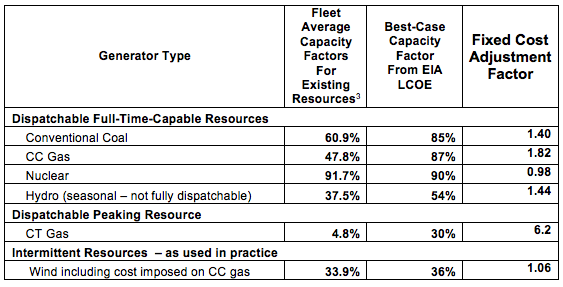
Table 3: Applying the Fixed Cost Adjustment Factor from Table 2
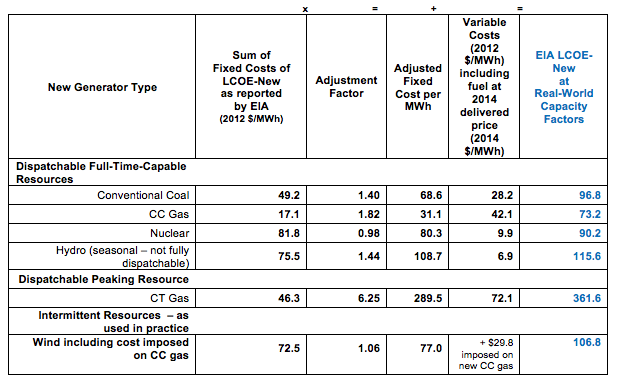
As in previous tables, variable costs of natural gas include fuel at average 2014 delivered prices.
Table 4: The Cost Premium of New Resources over Existing
[1] After backing out $15.6/MWh (3%) adder to the cost of capital representing EIA’s anticipation of a future CO2 emissions “surcharge”
[2] Fuel costs derived by subtracting variable cost reported in “ Updated Capital Cost Estimates for Electricity Generation Plants, November 2010” produced by R.W. Beck, Inc. for U. S. Energy Information Administration Office of Energy Analysis, U.S. Department of Energy (Page 7, Table 1) from EIA LCOE 2019 variable O&M including fuel.
Coal: EIA modeled fuel cost was $26.1/MWh. At 2014’s delivered fuel price and heat rate, the fuel cost is $23.9/MWh
CC Gas: EIA modeled fuel cost was $45.7/MWh. At 2014’s delivered fuel price and heat rate, the fuel cost is $38.7/MWh
CT Gas: EIA modeled fuel cost was $67.3/MWh. At 2014’s delivered fuel price and heat rate, the fuel cost is $57.4/MWh
Uranium: EIA modeled fuel cost was $9.8/MWh. At 2014’s delivered fuel price and heat rate, the fuel cost is $7.9/MWh
[3] http://www.eia.gov/electricity/monthly/epm_table_grapher.cfm?t=epmt_6_07_a and http://www.eia.gov/electricity/monthly/epm_table_grapher.cfm?t=epmt_6_07_b
