
The so-called “social cost of carbon” ostensibly measures (in present dollars) the total value of all future climate change damages coming from the emission of another unit of carbon dioxide. The social cost of carbon (SCC) is thus extremely important in the climate change policy debate, as it is already being used in cost/benefit calculations of federal energy regulations.
Because the SCC plays such a large role in discussions of mandates and a potential carbon tax, it is important to highlight the work of four researchers who found that the climate change literature contains a substantial bias in SCC estimates. Specifically, Havranek et al. found that published estimates of the SCC seemed skewed to the right of $0/ton. In other words, whether coming from the study authors or from the journal editors, there is objective evidence that the literature excludes estimates of the SCC in the negative region, which would correspond to carbon dioxide emissions being good for humanity. In the present post I’ll sketch their argument and evidence in their favor, and then comment on the magnitude of the apparent selection bias.
Detecting Bias
The average person might be baffled at how researchers could possibly detect widespread selection bias—or “selective reporting,” the term the study authors consider more accurate—in published papers, without getting inside the heads of the journal editors or without hacking into their email accounts.
The authors use a clever technique, adapted from a broader literature on detecting selective reporting (for papers on all sorts of subjects, not necessarily on climate policy). For this blog post, I’ll focus just on the techniques our study authors used for detecting bias in estimates of the social cost of carbon (SCC). I am going to give the “intuition” behind their technique and their results, but of course for full details the reader should click the link to see the actual paper.
What Would Bias Look Like With the SCC?
First, we have to realize that in the SCC literature, studies do not necessarily just produce a “point estimate,” but often they will provide a range of values that includes the “true” social cost of carbon with a certain degree of confidence. For example, such a study might report: Our computer model produced a median estimate of the social cost of carbon at $40/ton, but allows that the true social cost of carbon could fall anywhere in the range of $15/ton to $100/ton with 95% confidence.
Now what would happen if people in this field—whether the authors themselves or the journal editors—didn’t want to publish ranges of the true SCC that fell into negative territory? It would mean that if we surveyed all of the published results, we would notice an odd pattern: As the point estimates of the SCC got lower—closer to $0/ton—we would have to see the confidence interval get tighter, so that the lower bound on the range was still above $0/ton.
Consider again our example above, where the point estimate was $40/ton but the lower bound was $15/ton. That result would be fine to publish, because there’s no danger that anyone will think carbon dioxide emissions are good for humanity. But what if different researchers came up with a point estimate of only $20/ton, and a lower bound of -$5/ton? If the researchers and/or the journal editors were uncomfortable with that outcome, they might put the paper in a drawer, never again to see the light of day.
Stick with me for one last example, and we’ll see the payoff: Suppose now there were a third team of researchers, and their computer model spit out a point estimate of $5/ton, with a lower bound of $4/ton (with 95% confidence). Notice that that point estimate is much more “precise”—in terms of the researchers’ confidence—because the lower bound is so close to it, relatively speaking. And since the lower bound on the “true” social cost of carbon is still safely in positive territory, meaning carbon dioxide emissions are bad, then the authors and/or journal editors would be fine to publish the result.
Stepping back, what does it all mean? The implication is that if researchers and/or journal editors systematically disfavored estimates that included a negative value on the lower range for the social cost of carbon, then looking over a large sample of such published estimates, we would find that the associated “precision” was much higher, as the point estimates approached $0/ton. To repeat, this pattern would occur because if a point estimate close to $0/ton were not very precise, then the lower range would cross into negative territory (meaning emissions had positive social benefits), and so such a result would not survive the publication process.
The Results
Armed with the above technique, Havranek et al. reviewed 267 reported estimates of the SCC from the literature, and plotted the point (i.e. median) estimate of the social cost of carbon on the x-axis, against the associated precision (which was the inverse of the “standard error”) on the y-axis. The result is startling:
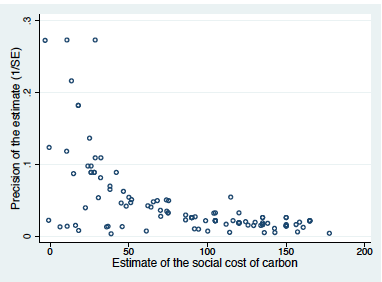
It is clear from the chart that the apparent precision of the estimate gets much higher, as the estimate approaches $0/ton from the right. (To avoid confusion, note that the above chart—as well as every value in the paper—quote the SCC in dollars per ton of carbon. To convert to dollars per ton of carbon dioxide, divide the figures by 3.67.)
The above chart is exactly what we would expect to see if researchers and/or editors, whether consciously or unconsciously, rejected estimates of the SCC that included negative values in their range. If there were no bias, and if (say) the “true” SCC were $30/ton of CO2, then in the chart above we should see a bell curve centered at about $110 on the x-axis (because $30 x 3.67 = $110).
In contrast, what we clearly see is that the apparent precision of the SCC estimates zooms upward as they get close to zero. To be clear, there is not a “mirror image” on the other side of the y-axis that the authors are failing to show us; the vast majority of “point” estimates of the SCC in the literature fall well within positive territory. One obvious way to make sense of the above graph, then, is to conclude that people in this field do not want to see estimated ranges of the SCC that include negative values.
The Size of the Bias
Beyond graphical results, Havranek et al. run five different regressions (using different specifications for each one), trying different ways to quantify the size of the apparent selection bias in the literature. Using a sample of 267 reported estimates[1] of the SCC with a mean value of $112/ton of CO2, Havranek et al. found in their five different regression approaches that the “corrected” mean SCC was $37, $28, $3, $17, and negative $5.[2] Now it is true that only the first “corrected” estimate is statistically significant (at the 5% level), but note that even that estimate is only one-third the uncorrected sample.
The interested reader can read the actual paper to see more details, but it should be clear that correcting for the apparent selection bias in the reported SCC estimates is huge. To repeat the most amazing result from above: One plausible adjustment approach takes the mean value from a sample of the literature of $112/ton of CO2 and, after correcting for the apparent selection bias, estimates that the actual SCC is negative $5/ton.
How the “Mean” Can Get Big, Especially With Bias Against Negative Values
It might help shed light on the bigger picture if we elaborate on the results from the previous section. To some readers, at first it might seem odd that the mean of SCC estimates sampled from the literature (among the estimates that had confidence intervals, allowing Havranek et al. to use them in their study) had such a high value of $112/ton, while the corrections pushed the number way down—even into negative territory, for one of the adjustment approaches. But the intuition here is that with the apparent bias against negative values, the sky is the limit on upward estimates of the SCC. Therefore taking the arithmetic mean of these figures, we shouldn’t be surprised to get a big number, because (apparently) there is a strong bias against including negative numbers in the sample, which would of course pull down the mean.
We can get a better idea of the problem by considering the actual data that Havranek et al. used in their analyses. Of the 267 estimates of the SCC (drawn from the literature, where authors performed various model runs using different assumptions and so forth), the mean was $112/ton of carbon dioxide. However, the median was only $66/ton. Furthermore, out of the sample 267 estimates of the social cost of carbon, 51 of them (i.e. 19%) were $20 or below, 97 of them (i.e. 36%) were $39 or below, and 154 of them (i.e. 58%) were $79 or below.
Thus we can see that the estimates were bunched up on the lower end of the spectrum, with a few outliers—such as single estimates of $712, $933, and $1,129 at the far right end—driving up the averages. In this context, it is very significant that there was only one negative value (at negative $1). As Havranek et al. point out in their study, this approach stacks the deck, making the “published estimates” of the SCC larger than the underlying models may really indicate.
Conclusion
A working paper by Havranek et al. shows strong prima facie evidence that there is a significant selection bias—or “selective reporting” as they prefer to call it—in the literature on the social cost of carbon. Using various techniques to adjust the published estimates for this apparent bias, Havranek et al. find that the average results in the literature are arguably at least three times too high. Under one plausible adjustment, they took a sample mean of $112/ton and adjusted it to a “true” SCC of negative $5/ton of CO2.
These striking results do not directly impact the estimates of the social cost of carbon published by the Obama Administration’s Working Group, because Havranek et al.’s were, strictly speaking, just examining the pattern of results in the published literature. The Working Group itself ran thousands of simulations using three leading computer models, and then reported summary results itself.
Even so, we should note that corrected for the apparent bias, the various estimates derived from the broader literature suggest that the headline SCC figures put out by the Obama Administration Working Group are on the high end. Furthermore, if there is (apparently) widespread selection bias against negative SCCs in the literature, we should be on the look-out for such bias in other avenues. For example, one of the Havranek et al. authors (in personal communication) told me that the Working Group’s simulations relied on “standard” estimates of climate sensitivity from the climate science literature—but their team has found evidence of selection bias in that literature as well!
The final words on this subject are best taken from the Havranek et al. study, where they try to explain why such bias apparently exists against publishing negative values for the SCC. They write: “[W]e do not suggest that selective reporting in the literature on the social cost of carbon is intentional; in contrast, we believe that…it reflects the implicit urge to produce interesting results that are useful for policy-making: results that, in this case, help save the planet.”
[1] Note that Havranek et al. drew on a much smaller number of studies to derive their 267 estimates. In other words, a given published study might generate several estimates of the SCC (perhaps with different assumptions about climate sensitivity, etc.).
[2] To repeat, Havranek et al. report their values in terms of tons of carbon, meaning the figures in their paper are 3.67 times higher than what I am writing in the text above. I have converted to tons of carbon dioxide because that is standard in the U.S. climate policy debate.
