
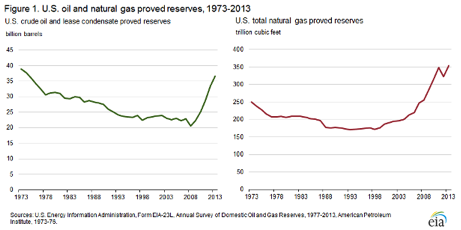
U.S. oil and natural gas proved reserves[1] have each grown by almost 10 percent from the end of 2012 to the end of 2013. According to the Energy Information Administration (EIA), U.S. oil reserves have hit a 38 year high at 36.5 billion barrels. In 2013, proved reserves of crude oil and lease condensate increased by 3.1 billion barrels, exceeding 36 billion barrels for the first time since 1975.Texas held the highest level of oil and condensate reserves, followed by North Dakota, whose reserves exceeded those in the federally held sections of the Gulf of Mexico, where reserve growth has stagnated during the Obama Administration.[i]
Natural gas reserves in 2013 increased by about 10 percent, setting a new record at 354 trillion cubic feet, reversing a surprising decline that occurred in 2012. Natural gas proved reserves increased by 31 trillion cubic feet in 2013. The Marcellus shale formation in Pennsylvania and West Virginia accounted for 70 percent of the increase in natural gas reserves. Pennsylvania had the largest increase in natural gas reserves among the states at 13.5 trillion cubic feet. Shale gas represented 45 percent of the natural gas reserves in 2013, up from a 40 percent share in 2012.
Increased drilling and production using hydraulic fracturing and horizontal drilling technologies were largely the reason for these large gains in reserves. Since 2008, U.S. oil production increased by almost 50 percent and U.S. natural gas production increased by over 20 percent. These technologies were also a major reason for oil prices reaching their lowest level in four years.
Source: EIA, http://www.eia.gov/naturalgas/crudeoilreserves/
Oil and Condensate Reserves
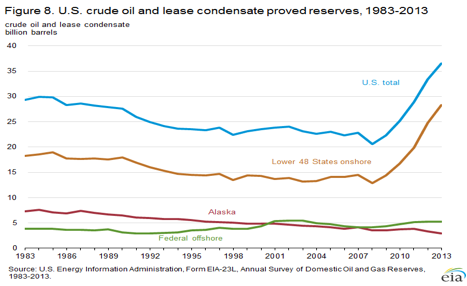
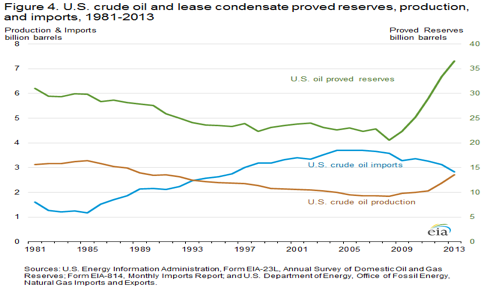
In 2013, U.S. crude oil and lease condensate proved reserves increased to 36.5 billion barrels—an increase of 9.3 percent from 2012 (3.1 billion barrels). U.S. proved reserves of crude oil and lease condensate increased for the fifth year in a row in 2013, exceeding 36 billion barrels for the first time since 1975.
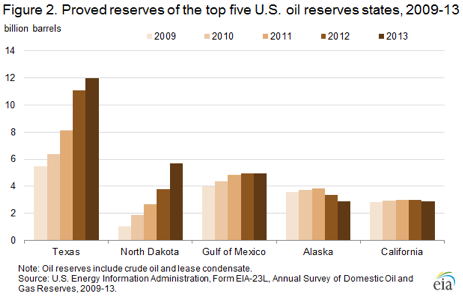
Proved reserves of crude oil and lease condensate increased most in Texas and North Dakota in 2013 (See Figure 2). North Dakota had the largest increase in proved reserves, totaling 1.9 billion barrels (61 percent of the nation’s total net increase in 2013). This increase was driven by continued development at the Bakken and Three Forks shale formations. As can be seen from the chart below, North Dakota’s proved reserves of crude oil and lease condensate exceeded those of the federal offshore Gulf of Mexico in 2013, making it the second largest oil reserves state in the United States. Texas had the second largest increase of 0.9 billion barrels, which came mostly from the Eagle Ford and other tight formations in the Permian Basin. North Dakota and Texas combined to account for 90 percent of the overall net increase in U.S. proved oil reserves in 2013.
Source: Energy Information Administration, http://www.eia.gov/naturalgas/crudeoilreserves/
Source: Energy Information Administration, http://www.eia.gov/naturalgas/crudeoilreserves/
Natural Gas Proved Reserves
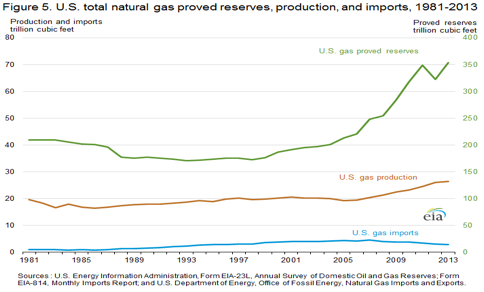
U.S. proved reserves of natural gas set a record in 2013 at 354 trillion cubic feet, more than offsetting the significant decline experienced in 2012. The increase in natural gas reserves in 2013 was mainly due to an increase in natural gas prices. The average spot natural gas price at the Henry Hub increased from $2.75 per million Btu in 2012 to $3.66 per million Btu in 2013. In 2011, the average spot natural gas price at the Henry Hub decreased from $4.15 per million Btu to the $2.75 per million Btu experienced in 2012.
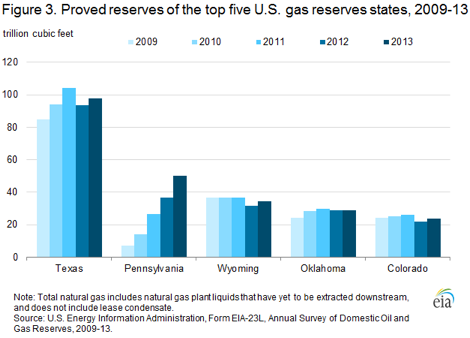
In 2013, proved natural gas reserves increased in each of the top five U.S. gas reserves states: Texas, Pennsylvania, Wyoming, Oklahoma, and Colorado. (See Figure 3) Pennsylvania’s natural gas proved reserves increased by 13.5 trillion cubic feet in 2013–the largest increase of the 5 states. This increase was the result of extensions to fields in the Marcellus shale play. The reserves additions in Texas and Oklahoma also were mostly from extensions in shale natural gas plays. In Wyoming and Colorado, increased natural gas reserves were due primarily to positive net revisions to large conventional gas fields.
Source: Energy Information Administration, http://www.eia.gov/naturalgas/crudeoilreserves/
Oil and Natural Gas Production and Imports
The growth in reserves was accompanied by an increase in production. In 2013, crude oil and lease condensate production increased 14 percent from 2012 levels to 2.7 billion barrels – the fifth consecutive production increase.[2] Oil and lease condensate production from the Lower 48 states increased 16 percent from 2012 levels; production in Alaska declined by 3 percent.
Natural gas production increased 1.4 percent and represented a new record at 26.5 trillion cubic feet. It was the eighth consecutive year that natural gas production increased.
Increased production of oil and natural gas results in lower imports of these fuels. In 2013, crude oil imports declined by almost 10 percent (Figure 4) and natural gas imports declined by 8 percent (Figure 5).
Source: Energy Information Administration, http://www.eia.gov/naturalgas/crudeoilreserves/
Source: Energy Information Administration, http://www.eia.gov/naturalgas/crudeoilreserves/
Conclusion
Proved reserves are just one small segment of our total energy resources. In fact, proved reserves are the smallest segment of our natural gas and oil resources. Proved reserves are defined by EIA as the estimated amount of hydrocarbon resources that “analysis of geologic and engineering data demonstrates with reasonable certainty are recoverable under existing economic and operating conditions.” Politics heavily impacts our proved reserves because the federal government and some state governments forbid people from exploring for natural gas and oil in many promising places. In other words, there is plenty of opportunity for our natural gas and oil resources to continue to grow if people can explore in new areas and as new technology develops.
It is important to note the impact of increased domestic oil and natural gas production. Increased U.S. oil production, driven mainly from hydraulic fracturing and horizontal drilling, (and aided by a sluggish global economy) has driven oil prices down significantly. The oil price decline has shaken OPEC nations and Russia–countries that rely heavily on oil export revenues to fund their government budgets. Oil prices have dropped to the point where they are below the breakeven point for most of these countries to balance their budgets.[ii] Even with lower prices, forecasts by EIA and the International Energy Agency still expect U.S. oil production to continue to increase and increasing reserves help to make those forecasts a reality.
[1]Proved reserves are estimated volumes of hydrocarbon resources that analysis of geologic and engineering data demonstrates with reasonable certainty are recoverable under existing economic and operating conditions.
[2] The oil production estimates are based on data reported on Form EIA-23L, Annual Survey of Domestic Oil and Gas Reserves, which differ slightly from the official U.S. EIA production data for crude oil and lease condensate contained in the Petroleum Supply Annual 2013, DOE/EIA-0340(13).
[i] Energy Information Administration, U.S. Crude Oil and Natural Gas Reserves, December 4, 2014, http://www.eia.gov/naturalgas/crudeoilreserves
[ii] Institute for Energy Research, https://www.instituteforenergyresearch.org/analysis/u-s-oil-production-steady-upswing-despite-lower-oil-prices/
