
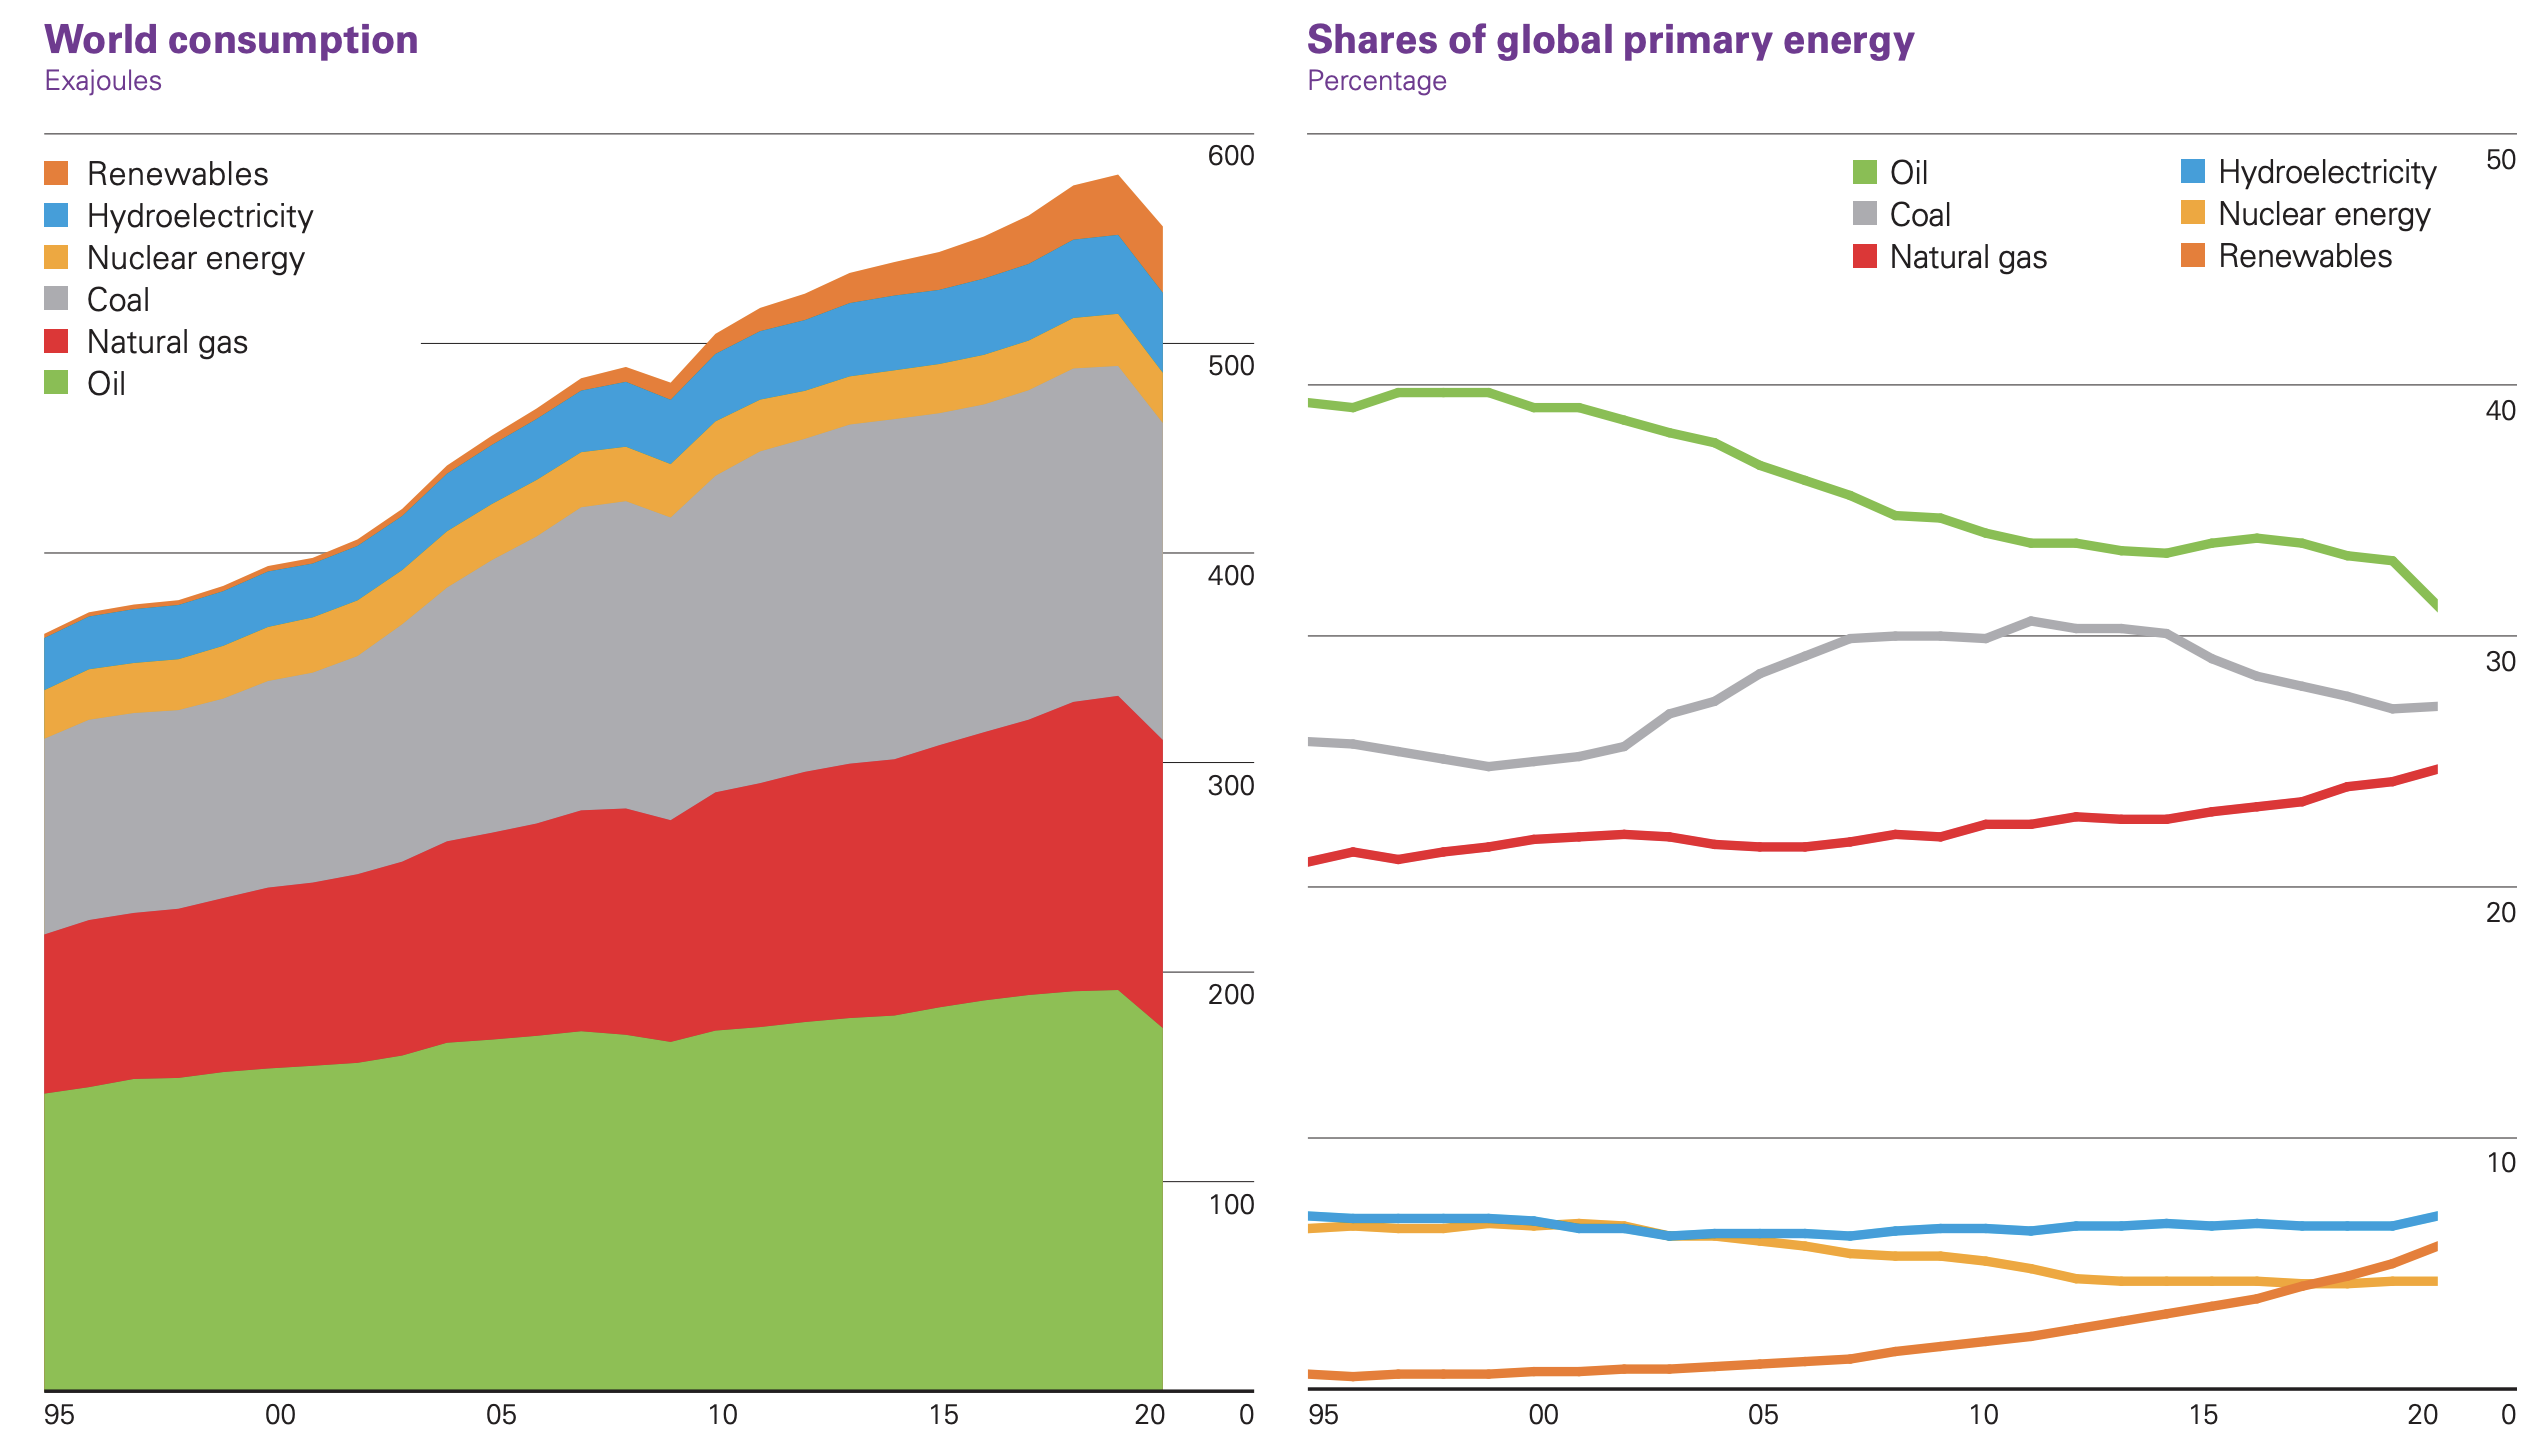
According to the BP Statistical Review of World Energy, global energy consumption fell by 4.5 percent in 2020—the first decline since 2009—due to the COVID-19 pandemic that created economic lockdowns for many countries. Both primary energy consumption and carbon dioxide emissions declined at their fastest rates since the Second World War. Oil, natural gas, coal, and nuclear declined while hydroelectricity and renewable energy increased, 1 percent and 9.7 percent, respectively. Oil’s decline was the largest at 9.7 percent and accounted for almost three-quarters of the decrease. The United States, India, and Russia contributed the largest declines in energy consumption, while China posted an increase of 2.1 percent—the largest increase of the few countries where energy demand grew last year. Carbon dioxide emissions from energy use fell 6.3 percent—their lowest level since 2011.
Oil continued to have the largest share in the 2020 energy mix (31.2 percent), followed by coal (27.2 percent) and natural gas (24.7 percent). Natural gas, coal, hydroelectricity, and renewable energy increased their shares, while oil and nuclear energy (4.3 percent) lost share. While non-hydro renewable energy increased its share to a record 5.7 percent, its share remained below that of hydroelectricity (6.9 percent), which was the first increase in share for hydro since 2014. (See graph below.)
Oil
The oil price (Brent) averaged $41.84 per barrel in 2020 – the lowest price since 2004. Oil consumption fell by a record 9.1 million barrels per day (9.3 percent)—its lowest level since 2011. The largest declines were in the United States, declining 2.3 million barrels per day, the European Union, declining 1.5 million barrels per day and India with a decline of 480,000 barrels per day. China was the only country where oil consumption increased (220,000 barrels per day).
Global oil production declined by 6.6 million barrels per day, with OPEC accounting for two-thirds of the decline. Libya and Saudi Arabia saw the largest OPEC declines with declines of 920,000 barrels per day and 790,000 barrels per day, respectively. Non-OPEC reductions were led by Russia with a production decline of 1.0 million barrels per day and the United States with a production decline of 600,000 barrels per day.
Refinery utilization fell by a record 8.0 percentage points to 74.1 percent—the lowest level since 1985.
Natural Gas
Natural gas prices declined to multi-year lows: U.S. Henry Hub averaged $1.99 per million Btu in 2020 – the lowest since 1995, while Asian LNG prices (Japan Korea Marker) registered their lowest level on record ($4.39 per million Btu). Natural gas consumption fell by 81 billion cubic meters (2.3 percent), despite the share of natural gas in primary energy increasing, reaching a record high of 24.7 percent.
Declines in gas demand were led by Russia (33 billion cubic meters) and the United States (17 billion cubic meters), with increased demand in China (22 billion cubic meters) and Iran (10 billion cubic meters).
Inter-regional gas trade by pipeline dropped by 54 billion cubic meters (10.9 percent). LNG supply grew by 4 billion cubic meters (0.6 percent)—well below the 10-year average rate of 6.8 percent per annum. U.S. LNG supply expanded by 14 billion cubic meters (29 percent).
Coal
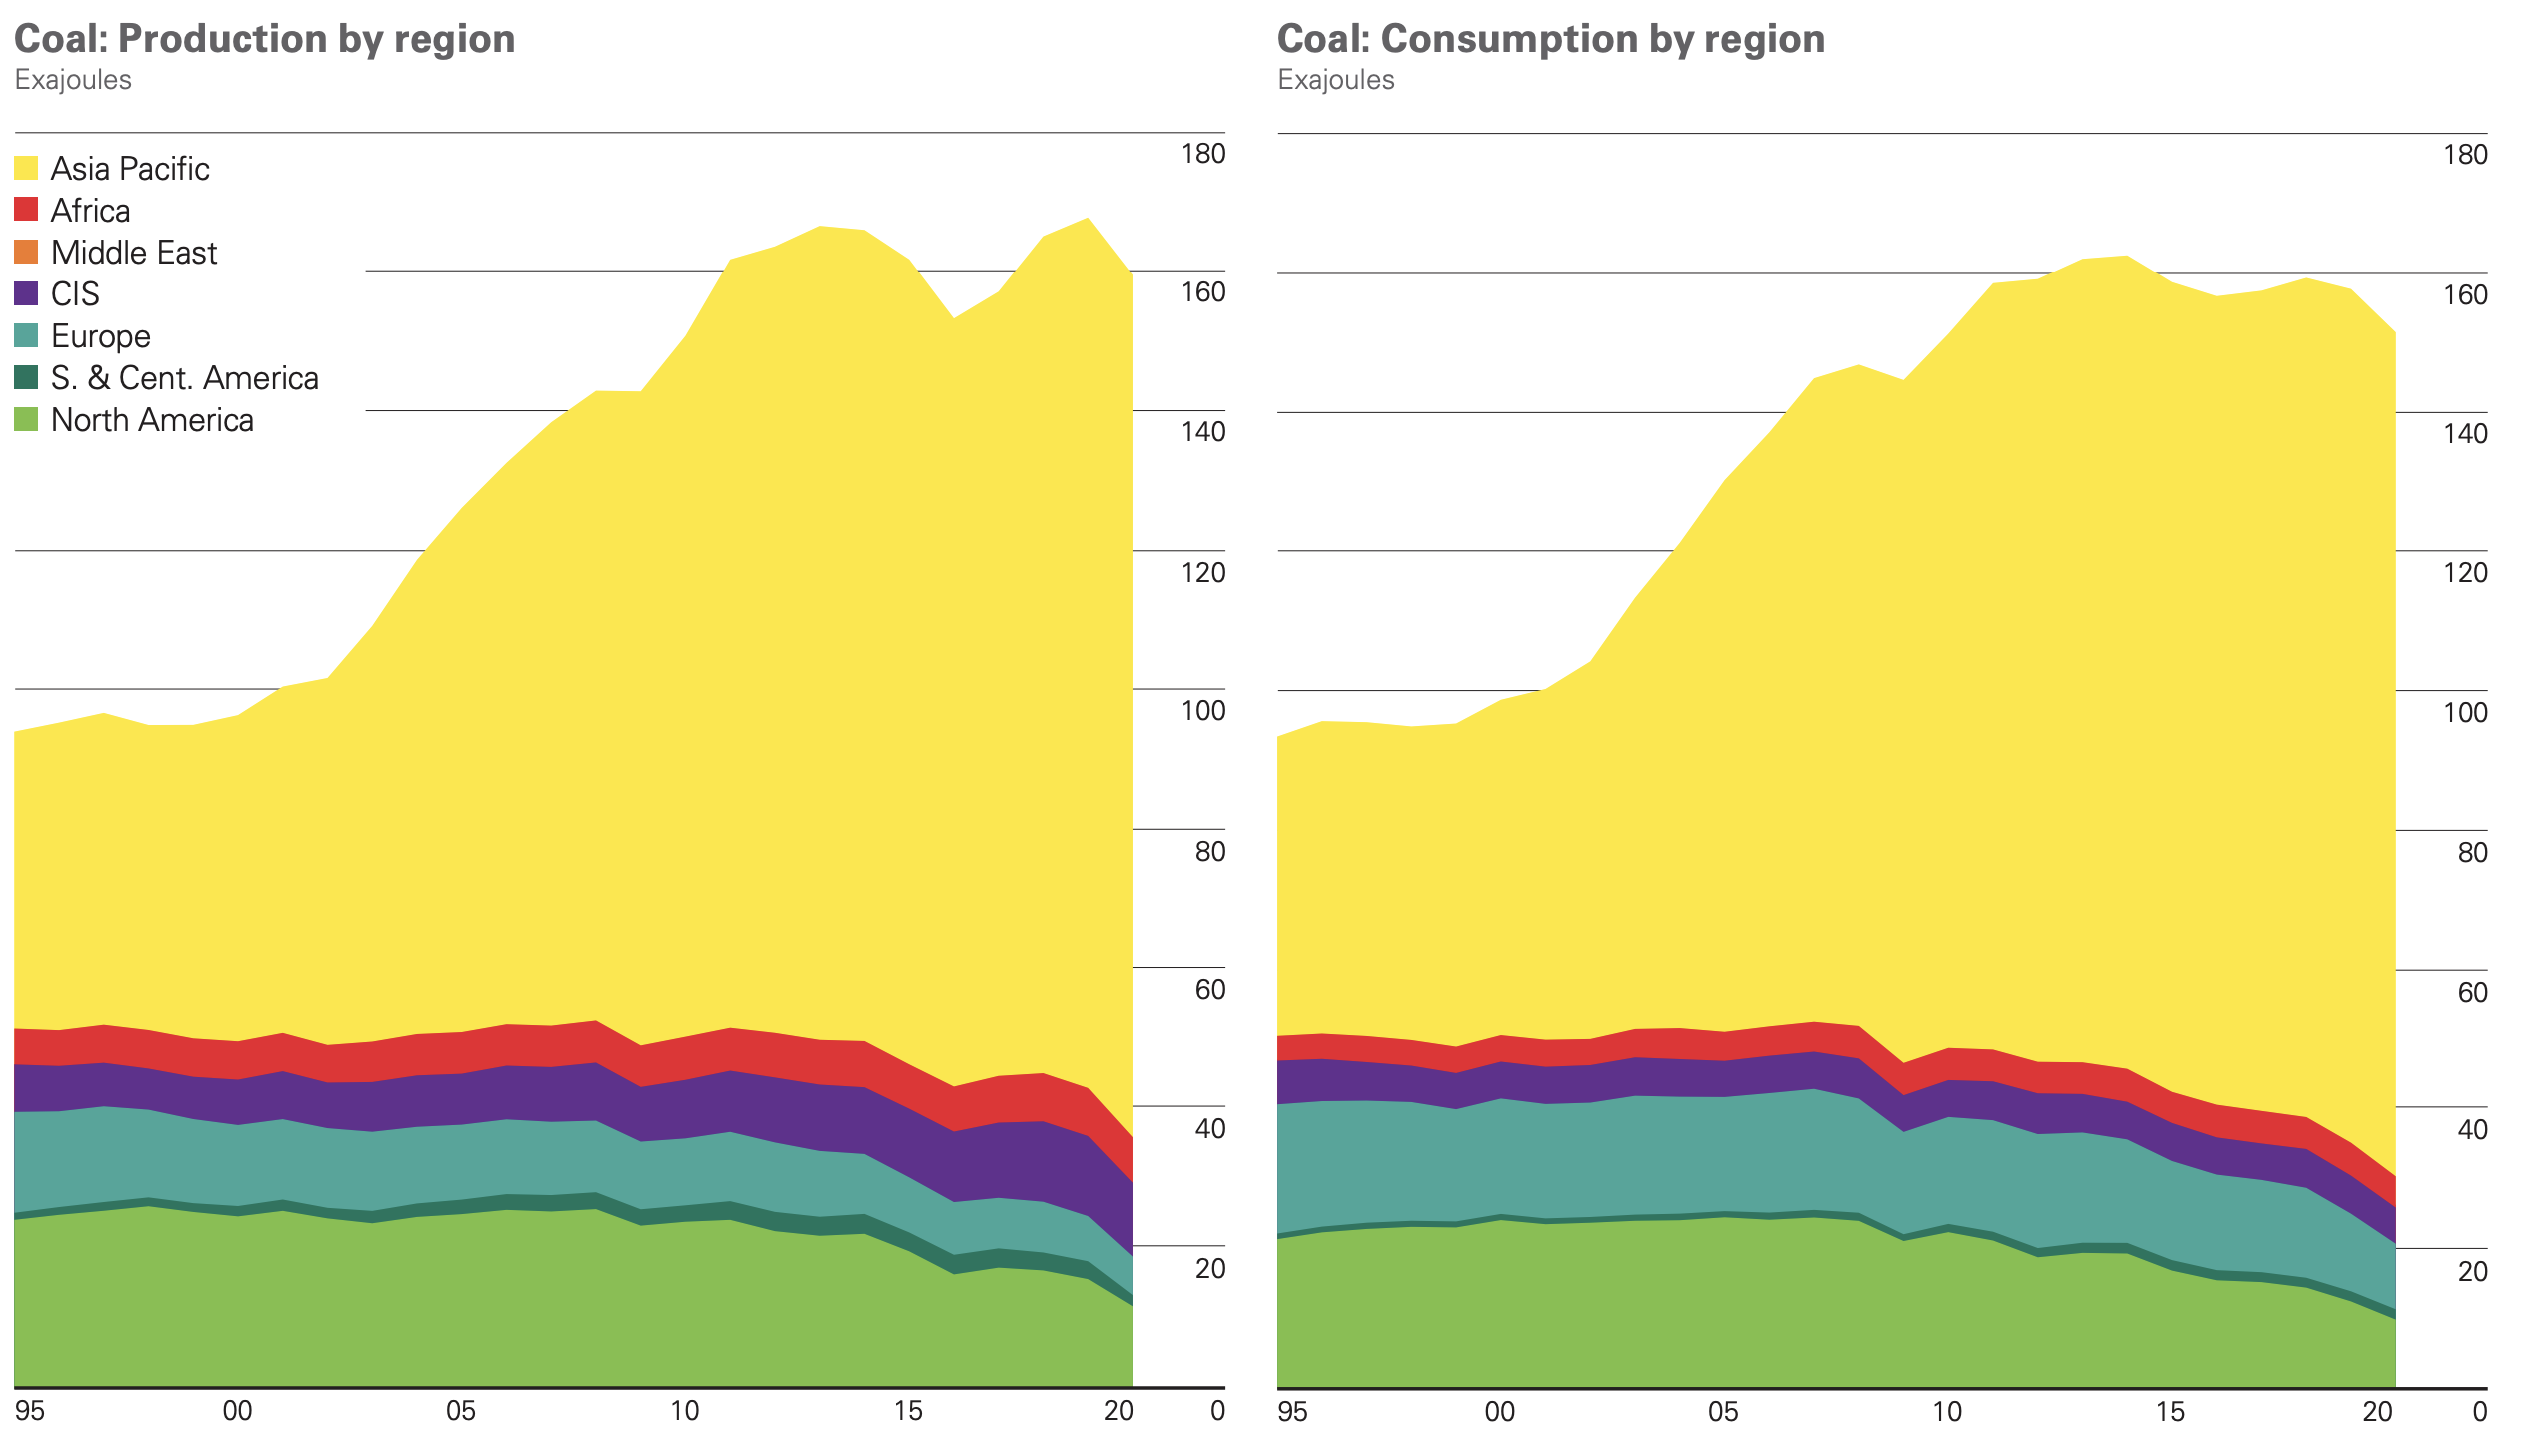
World coal consumption fell by 4.2 percent—its fourth decline in six years. OECD coal demand fell sharply, led by the United States with a decline of 19.1 percent and South Korea, whose decline was 12.2 percent. In the non-OECD, coal consumption increased in China by 0.3 percent and Malaysia by 18.7 percent, while significant consumption declines were recorded for India at 6 percent and Indonesia at 4.9 percent.
Global coal production declined by 5.2 percent, with the largest production declines occurring in the United States, falling 25.2 percent and Indonesia, falling 9.0 percent. China’s coal production increased by 1.2 percent.
Electricity
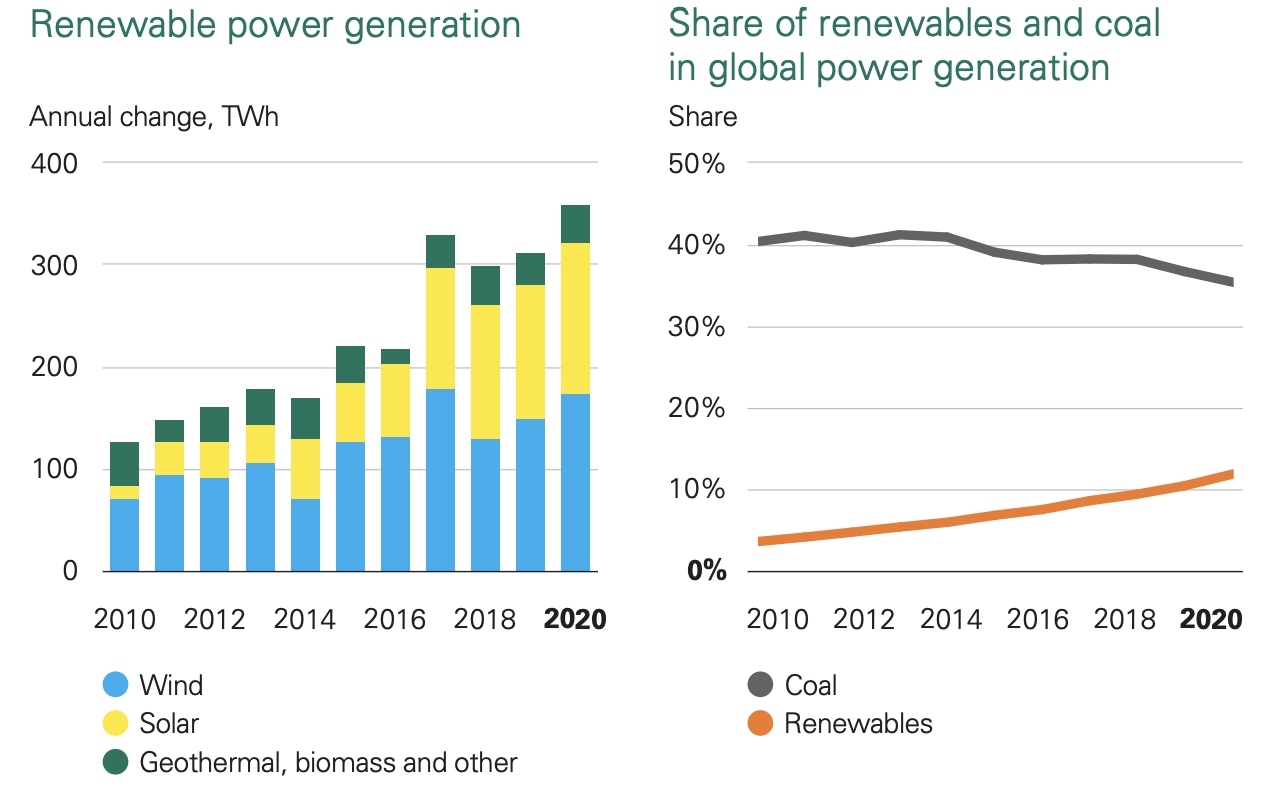
Electricity consumption declined by just 0.9 percent in 2020—the smallest decline across the main components of final energy demand. The decline in electricity demand in the industrial and commercial sectors was partially offset by increased consumption by workers based at home and their families. Despite the fall in overall power demand, generation from renewables (wind, solar, bioenergy and geothermal energy, excluding hydroelectricity) recorded its largest-ever increase (358 terawatt-hours), which was driven by strong increases in both wind (173 terawatt-hours) and solar (148 terawatt-hours) generation.
The share of renewables in global generation recorded its fastest-ever increase. Over the past five years, renewable generation has accounted for around 60 percent of the growth in global power generation, with wind and solar power more than doubling. The growth in renewables last year came largely at the expense of coal-fired generation, which experienced one of its largest declines on record (405 terawatt-hours or 4.4 percent). In addition to declining power demand and increasing deployment of renewables, coal was hurt by a loss of competitiveness relative to natural gas, especially in the United States and the European Union.
Wind and Solar Capacity
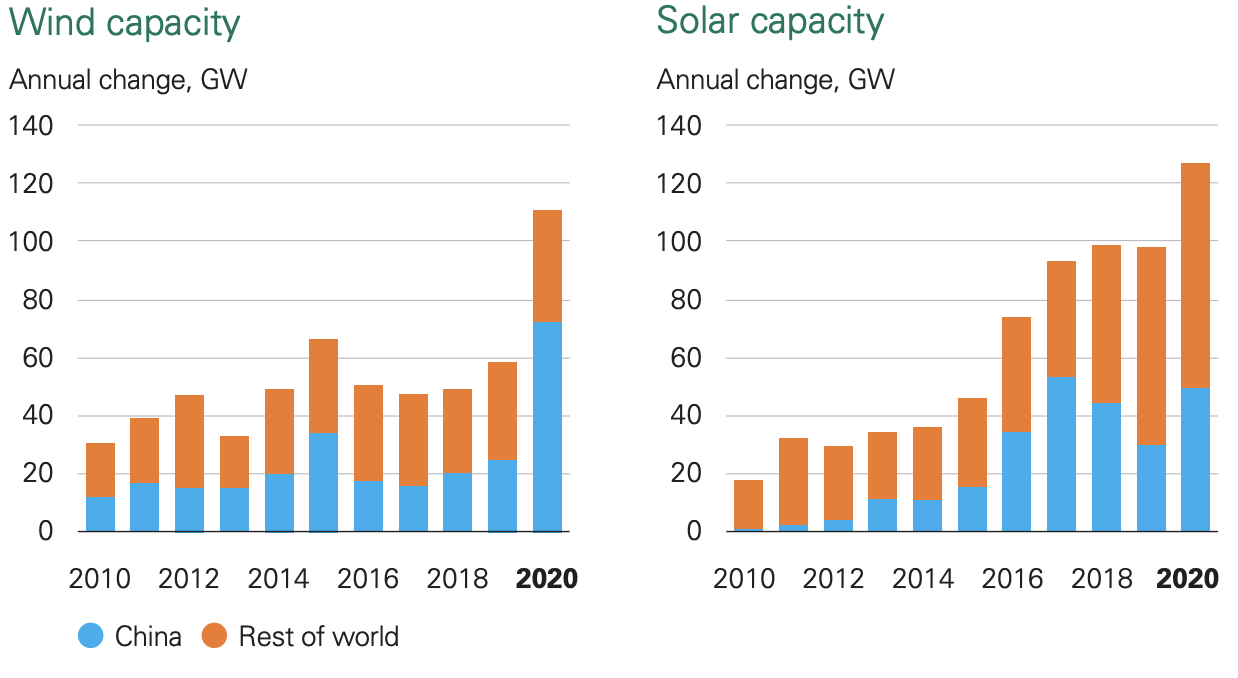
Wind and solar capacity increased by 238 gigawatts in 2020—50 percent larger than at any time in history. The main driver was China, which accounted for roughly half of the global increase in wind and solar capacity. (This may change as China will stop subsidizing new solar farm projects, distributed solar projects for commercial users, and onshore wind farms as of August 1.) China’s wind capacity increase totaled 72 gigawatts. Wind and solar capacity more than doubled between 2015 and 2020, increasing by around 800 gigawatts, equating to an average annual increase of 18 percent.
Conclusion
2020 was an unusual year for energy demand and energy production due to COVID-19 and the country lockdowns that resulted. While the contribution of all major forms of energy declined, renewable energy, particularly wind and solar, increased their contribution to electricity generation, which saw the smallest decline of all the major components of energy. Reductions in electricity generation in the industrial and commercial sectors was partially offset by increases in residential consumption due to employees working from home. Oil consumption saw the largest decrease of the major fuels due to the decline in driving and air travel due to lockdowns.
To reach the country commitments to the Paris climate agreement, and particularly those being updated and expanded, the energy declines of 2020 would need to be repeated, which is unlikely to occur as energy consumption is on the rebound with countries opening to travelers and businesses returning to producing goods at pre-pandemic levels. Countries need to evaluate their plans for feasibility before preceding given that their past commitments have not even been met.
