
The Energy Information Administration (EIA) released an early version of its Annual Energy Outlook (AEO) 2016, providing two cases—one incorporating EPA’s so-called Clean Power Plan and one without it.[i] Both cases include the renewable subsidies provided by Congress last December that enable renewable energy, primarily wind and solar power, to increase their generation and capacity substantially. Despite the wind and solar industry’s beliefs that their technologies are now competitive with fossil fuels, these AEO cases show that government subsidies and/or policies mandating renewables are needed to make them competitive with traditional forms of reliable and affordable energy. Under the Obama Administration, a fundamental transformation of our electricity system has begun, from one that has been responsive to demand to one that is much more reliant upon intermittent sources of energy.
Results of the Two Cases
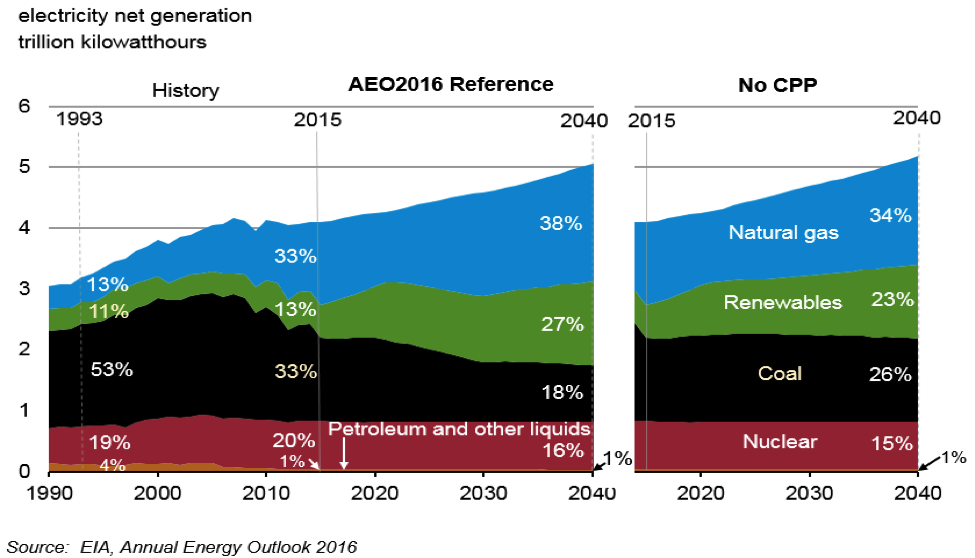
EIA assumes the Clean Power Plan (CPP) in its reference case[1] and includes a no Clean Power Plan (CPP) case for comparison. Both cases include the subsidies for renewable energy passed by Congress last December that maintain the production tax credit for wind energy and the investment tax credit for solar energy, though these subsidies are to be phased out over 5 years. As a result, renewable energy (including hydro) increases its generation share in both cases from 13 percent today to 23 percent in 2040 in the No CPP case and to 27 percent in 2040 in the reference case that includes the CPP. Natural gas also slightly increases its share from 33 percent today to 34 percent in 2040 in the no CPP cases and 38 percent in 2040 in the case with the CPP. The loser, of course, is coal, whose generation share declines from 33 percent today to 26 percent in 2040 in the no CPP case. However, with the CPP included, coal’s share is a dismal 18 percent, meaning even more coal miners will become unemployed due to EPA’s regulation.
Source: http://www.eia.gov/forecasts/aeo/er/pdf/0383er(2016).pdf
Coal
The premature retirements of coal-fired capacity total 100 gigawatts in the CPP case compared to 60 gigawatts in the case without the CPP. In the latter case, most of the coal capacity is retired by 2020 as the result of other EPA regulations such as the Mercury and Air Toxics Standard. In the no CPP case, coal generation levels remain relatively flat, as the remaining coal units are assumed to operate at higher levels and natural gas prices increase with increasing demand. In the case with the CPP, coal generation is expected to decline by 32 percent between 2015 and 2040 as a result of the additional retirements and lower levels of utilization to meet the carbon dioxide emissions caps mandated by the CPP.
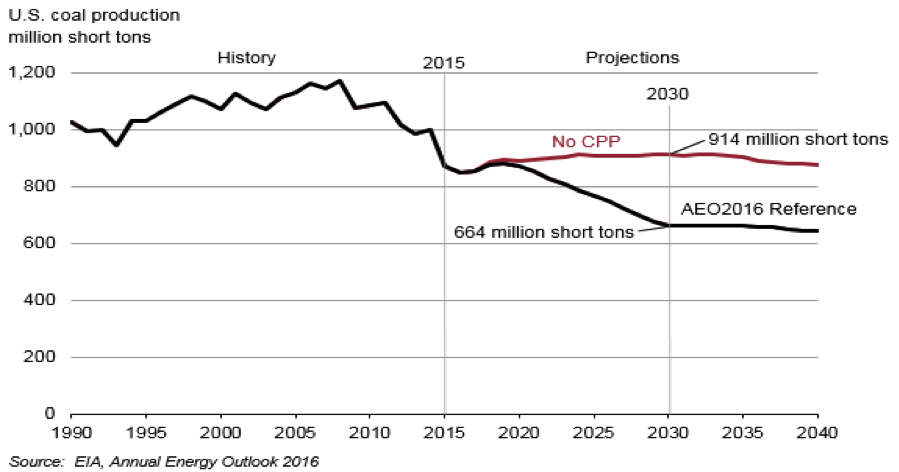
Coal production is 27 percent lower in the case that includes the CPP than the case without the CPP in 2040, dropping from about 870 million short tons in 2015 to 640 million short tons by 2040. EIA projects that even without the CPP, near-term coal plant retirements, competitive natural gas prices, and renewables expansion limit a recovery in the coal mining industry.
Early Release: Annotated Sum
Source: http://www.eia.gov/forecasts/aeo/er/pdf/0383er(2016).pdf
Natural gas
In the no CPP case, 109 gigawatts of natural gas combined cycle capacity are added and 24 gigawatts of turbine capacity are added to replace the retiring coal capacity and to meet increasing electricity demand. In the case with the CPP, more natural gas capacity (139 gigawatts of natural gas combined cycle capacity and 20 gigawatts of turbine capacity) is added due to the additional shuttered coal capacity. Natural gas generation increases by 44 percent in the case with the CPP and by 32 percent in the case without the CPP between 2015 and 2040. The natural gas share grows more substantially in the case with the CPP since natural gas is used to replace retiring coal generation to comply with the CPP. However, in the near term, EIA expects natural gas generation to decline due to rising natural gas prices and significant growth in renewable energy due to the production tax credit and investment tax credit extensions. (See chart below.) In both cases, natural gas generation surpasses coal generation by the mid to late 2020s.

Source: http://www.eia.gov/forecasts/aeo/er/pdf/0383er(2016).pdf
Renewable Energy
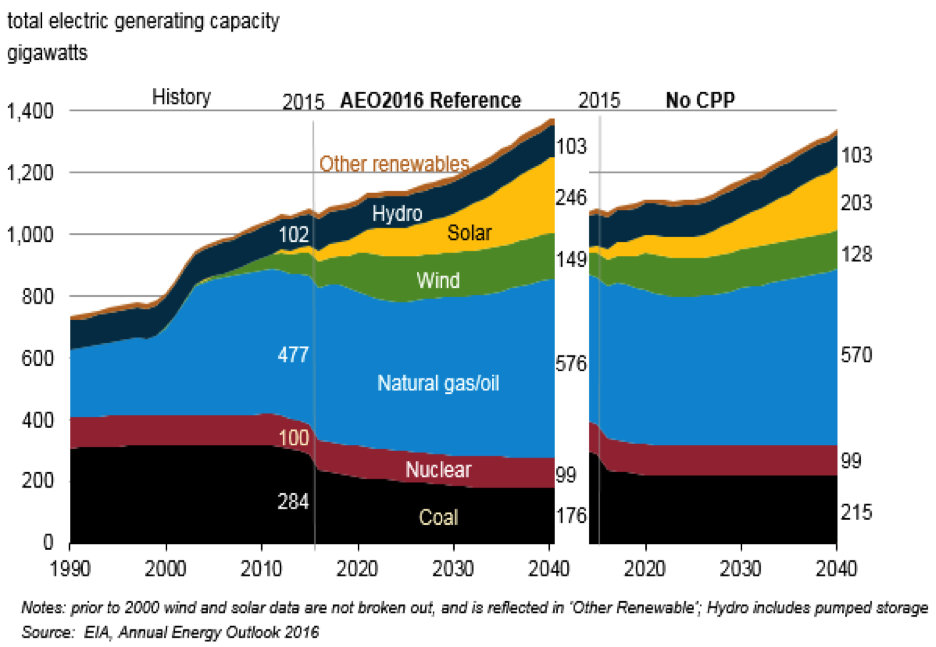
Renewable generation more than doubles by 2040 from 2015 levels in both of EIA’s cases due to government subsidies and state mandates. Of course, the renewable share increases even more when the CPP is included in the projection. In the case without the CPP, 252 gigawatts of renewable capacity are expected to be added by 2040. With the CPP, renewable capacity (including a small amount of hydro) is expected to grow by 318 gigawatts by 2040. Most of the additions are solar power (PV) as EIA assumes lower costs for solar installations. Solar capacity increases by 184 gigawatts in the no CPP case and by 227 gigawatts in the case with the CPP. The non-expiring 10 percent investment tax credit for solar projects, combined with continued capital cost reductions assumed by EIA for solar installations, encourages new solar capacity. Wind also sees sizable increases in capacity of 63 gigawatts in the no CPP case and 84 gigawatts in the case including the CPP. Unlike solar, wind projects receive a phased-out production tax credit that can only be claimed if wind plants are under construction before 2020. In the case with the CPP, renewable generation surpasses coal generation by the late 2020s.
Total electricity sales in 2040 are 2.7 percent lower in the case with the CPP than in the case without the CPP, but capacity additions are higher because more solar and wind energy are built. Due to much lower capacity factors for wind and solar power than for traditional forms of energy, larger amounts of capacity are needed to offset the coal-fired capacity being retired. Solar and wind power do not provide the same contribution to system reliability as coal, nuclear, or natural gas units.
Source: http://www.eia.gov/forecasts/aeo/er/pdf/0383er(2016).pdf
Nuclear
Nuclear generation levels remain flat throughout the projection as new units (Vogtle in Georgia and Virgil C. Summer in South Carolina) offset expected retirements. Because of high construction costs and no incentives from the CPP, no new, unplanned, nuclear plants are expected to be constructed with or without the CPP. The nuclear share of total generation declines in both cases as electricity demand grows.
Carbon Dioxide Emissions
The CPP requires power plants to reduce carbon dioxide emissions by 32 percent from 2005 levels by 2030. EIA finds that implementation of the CPP using a mass-based approach reduces annual electricity-related carbon dioxide emissions to between 1,550 and 1,560 million metric tons in the 2030 to 2040 period, below their 2005 and 2015 levels of 2,416 million metric tons and 1,891 million metric tons, respectively. Without the CPP, electricity-related carbon dioxide emissions remain below their 2005 level at 1,942 million metric tons in 2030 and 1,959 million metric tons in 2040 because of low load growth and generation mix changes driven by the extension of renewable tax credits, reduced solar photovoltaic (PV) capital costs, and low natural gas prices.
Conclusion
According to the EIA, renewable generation will exceed coal-fired generation before 2040 if the CPP overcomes the court challenges of over half of the affected states. Earlier this year, the Supreme Court put a stay on the rule until the lower courts could hear and decide upon the challenges and the CPP’s legality. Given the stay, it is surprising that EIA chose to include the CPP in its reference case. Nonetheless, EIA is clearly moving its forecast to substantial increases in wind and solar power as government subsidies, state mandates, and EPA regulations are implemented that encourage their use. The American public should view the experience of other countries and their journey to a renewable world to see how costly and unreliable that world can actually be.[ii]
[1] In a departure from its historic deference to existing law and regulations, EIA chose to incorporate the Clean Power Plan in its reference case, despite a Supreme Court stay of the regulation responding to lawsuits filed by a majority of affected states.
[i] Energy Information Administration, Annual Energy Outlook 2016 Early Release: Annotated Summary of Two Cases, May 17, 2016, http://www.eia.gov/forecasts/aeo/er/pdf/0383er(2016).pdf
[ii] IER, https://www.instituteforenergyresearch.org/analysis/lessons-sweden-germany/
