
The Executive Branch’s recently released Volume II of the National Climate Assessment (NCA) is a massive document that is being cited as yet further evidence that the U.S. government should act quickly and boldly in the fight against climate change. The coverage in the New York Times was typical: “All told, the report says, climate change could slash up to a tenth of gross domestic product by 2100, more than double the losses of the Great Recession a decade ago.”
Yet this claim is extremely misleading, as I’ll demonstrate in this post. The projection of a 10-percent hit to GDP is an extremely unlikely (less than a 5-percent chance) event even if we assume we are in the most pessimistic of emission scenarios, while the scenario itself rests upon an assumption that progress on renewables and other technologies occurs much more slowly over the next century than it has already occurred historically. This means that anybody citing the NCA projections isn’t allowed to also tout imminent breakthroughs in wind and solar, because such optimism renders the NCA projections invalid.
Even more astonishing, the NCA gives projections of the “cost of inaction” on climate change, but does not give any estimate of the costs of action on climate change. (It’s a bit like a mechanic warning that you need a new part to avoid engine failure down the road, but refusing to tell you how much the part will cost.) Yet if we follow the citations to other work (such as from the United Nations) that the NCA cites, we see that even using the NCA’s own diagram, it is not clear that aggressive steps to fight climate change would be worth the cost.
The NCA Warns of a Potential 10-Percent Hit to U.S. GDP1
The NCA is massive. In the interest of giving the reader a digestible chunk of analysis, in this post I am restricting myself to the material in Chapter 29, which covers the topic of “mitigation” and considers the economic impacts of climate change on the U.S. This chapter contains the chart that led New York Times reporters to write, “climate change could slash up to a tenth of gross domestic product by 2100.”
Here’s the chart in question, taken from Figure 29.3 of the Assessment:
Figure 1. Emissions and Damage Estimates from NCA Study
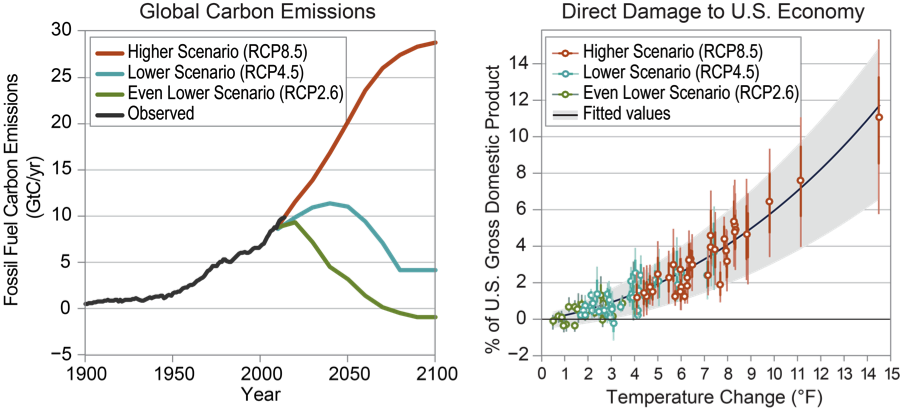
On the right panel of our Figure 1, we see where the NYT writers got their statistic. The far right bar shows that the midpoint of the gray “uncertainty range” is above a 10-percent level of damage to the U.S. economy.
However, how likely is this outcome? As the NCA chart itself shows, this enormous damage estimate is an outlier. In particular it is colored red, which the legend in the top left of the diagram shows is an “RCP8.5” scenario. The other RCP scenarios (blue and green bars) are nowhere near this level of warming or damage. Furthermore, notice that all of the other red bars indicate much smaller temperature increases, and hence damage.
The Unlikely RCP8.5 Scenario
As we’ve seen, the NCA can only generate the alarming outcome under the so-called RCP8.5 scenario. This refers to Representative Concentration Pathway, which is a series of benchmark scenarios used in climate science to have consistent assumptions in order to compare the results of different models. The number 8.5 refers to the amount of “radiative forcing” in effect in the year 2100, namely 8.5 watts per square meter. (The other scenarios, such as RPC4.5, of course have a similar meaning.)
The RCP8.5 scenario is the most pessimistic in the literature. It assumes rapid population growth coupled with a lack of progress in developing alternative technologies. As a scholarly article on the scenario explains:
Another important characteristic of the RCP8.5 scenario is its relatively slow improvement in primary energy intensity of 0.5% per year over the course of the century. This trend reflects the storyline assumption of slow technological change. Energy intensity improvement rates are thus well below historical average (about 1% per year between 1940 and 2000). [Bold added.]
Although the RCP8.5 could be classified as “business-as-usual” because it assumes no government policies to mitigate emissions, it nonetheless involves more emissions than most “business-as-usual” scenarios in the literature. In other words, it is a relatively pessimistic scenario to adopt, even if we assume no major government action.
And so we see that in order to focus attention on the RCP8.5 scenario, we are already building in pessimism, above and beyond the “governments do nothing” assumption. Furthermore, if writers at the NYT and elsewhere want to use the NCA’s worst-case projections as motivation for climate change, then they can’t also tout the continuing progress in “clean energy”—because the RCP8.5 scenario assumes a sudden stall in the historical progress on lowering emissions per unit of economic output.
10-Percent Damage Unlikely Even in the RCP8.5 Scenario
But wait, it gets worse. Even though we’ve seen how dubious the RCP8.5 scenario is, let’s stipulate for the sake of argument that we’ll be in it through the year 2100. Still, how likely is the extreme warming that the NCA report says could cause a 10-percent hit to the U.S. economy?
For that, we need to follow the citations. The chart in Figure 1 above ultimately comes from a 2017 Science article by Hsiang et al. In the Science version, the temperatures are expressed in Celsius, but otherwise it is clearly the same material.
Although the article doesn’t (as far as I can tell) give a specific number for the probability of various outcomes, it does show us this graph, indicating the “probability density function” of varying degrees of warming:
Figure 2. “Probability density” of various level of warming, according to NCA source
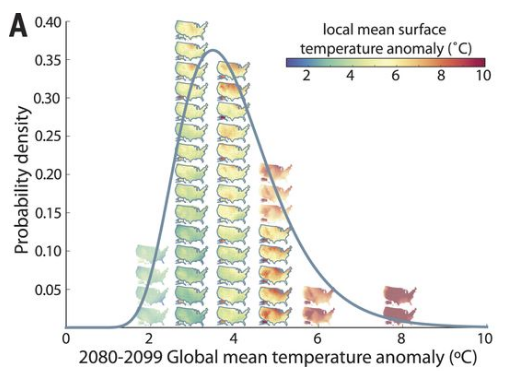
In order to get to the particular simulation involving a 10-percent hit to GDP, the Hsiang et al. study needs more than 7 degrees Celsius of warming. Yet as Figure 2 above shows—all assuming RCP8.5—that only happens on the far right-hand tail of the probability distribution. The overwhelming bulk of the area under the curve is well to the left of that much warming.
If this were a standard statistical test, we could safely “reject” the hypothesis of warming in the range necessary to generate the extreme damage projections.
NCA Ignores Cost of Climate Mitigation Policies
Although Chapter 29 presents estimates of the damage from climate change, when it comes to the possible economic damage from policies to fight it, the report is remarkably agnostic. Indeed it says in the second sentence:
This chapter does not evaluate technology options, costs, or the adequacy of existing or planned mitigation efforts relative to meeting specific policy targets, as those topics have been the subject of domestic (e.g., Executive Office of the President 2016, CCSP 2007, DeAngelo et al. 2017, NRC 20157 ,8 ,9 ,10 ) and international analyses (e.g., Fawcett et al. 2015, Clarke et al. 201411 ,12 ). [Bold added.]
Fortunately here at IER I have already explored the cost estimates in the Clarke et al. 2014 references, which are to the previous UN IPCC Fifth Assessment Report (AR5).
For a full recounting of my analysis, here is my post. For our purposes, the most important takeaway is this: According to the very literature that the NCA refers us to, the cost of limiting warming to 2 degrees Celsius by the year 2100 could be anywhere from 2.9 to 11.4 percent of consumption, with a best-guess of 4.8 percent.
Go look again at Figure 1 above, taken from the NCA report. Most of the projected outcomes involve less than 4.8 percent damage to the U.S. economy! Furthermore, the tradeoff is even worse than you might initially think. For even if we limited warming to two degrees Celsius (and incurred 4.8 percent damage to U.S. consumption), there would still be climate change damage, according to the official models—that’s why the UN recently urged an even lower target of 1.5 degrees.
This is why the most recent UN report, as well as the new NCA, refrain from engaging in a cost/benefit analysis altogether. If they did explicitly compare the costs of mitigation policies to the estimated economic impacts of climate change, then it wouldn’t even be close. To be sure, advocates of extreme intervention can point to unlikely but catastrophic scenarios, and/or they can say the models leave out important things, but it would be more difficult to then claim the mantle of “scientific consensus” when they are ignoring the Obama Administration’s own “social cost of carbon” estimates.
Conclusion
The recent NCA misleads the public, and the media should do a better job digging into the assumptions underlying its pronouncements. In particular, the alarming projections of economic damage rely on the RCP8.5 scenario, which is very pessimistic and in any event rules out the innovations in solar and wind that advocates assure us are just around the corner. Furthermore, even within the RCP8.5 scenario, it is unlikely that the U.S. will suffer extreme damage. The NCA itself doesn’t discuss the cost of mitigation policies, but the previous UN IPCC report did. Looking at the NCA’s own numbers, it’s not at all clear that pursuing aggressive government action to mitigate climate change would produce benefits in excess of costs.
