
- History of Electricity Distribution
- How Electricity Distribution Works
- The Economics of Electricity Distribution
- The Future of Electricity Distribution
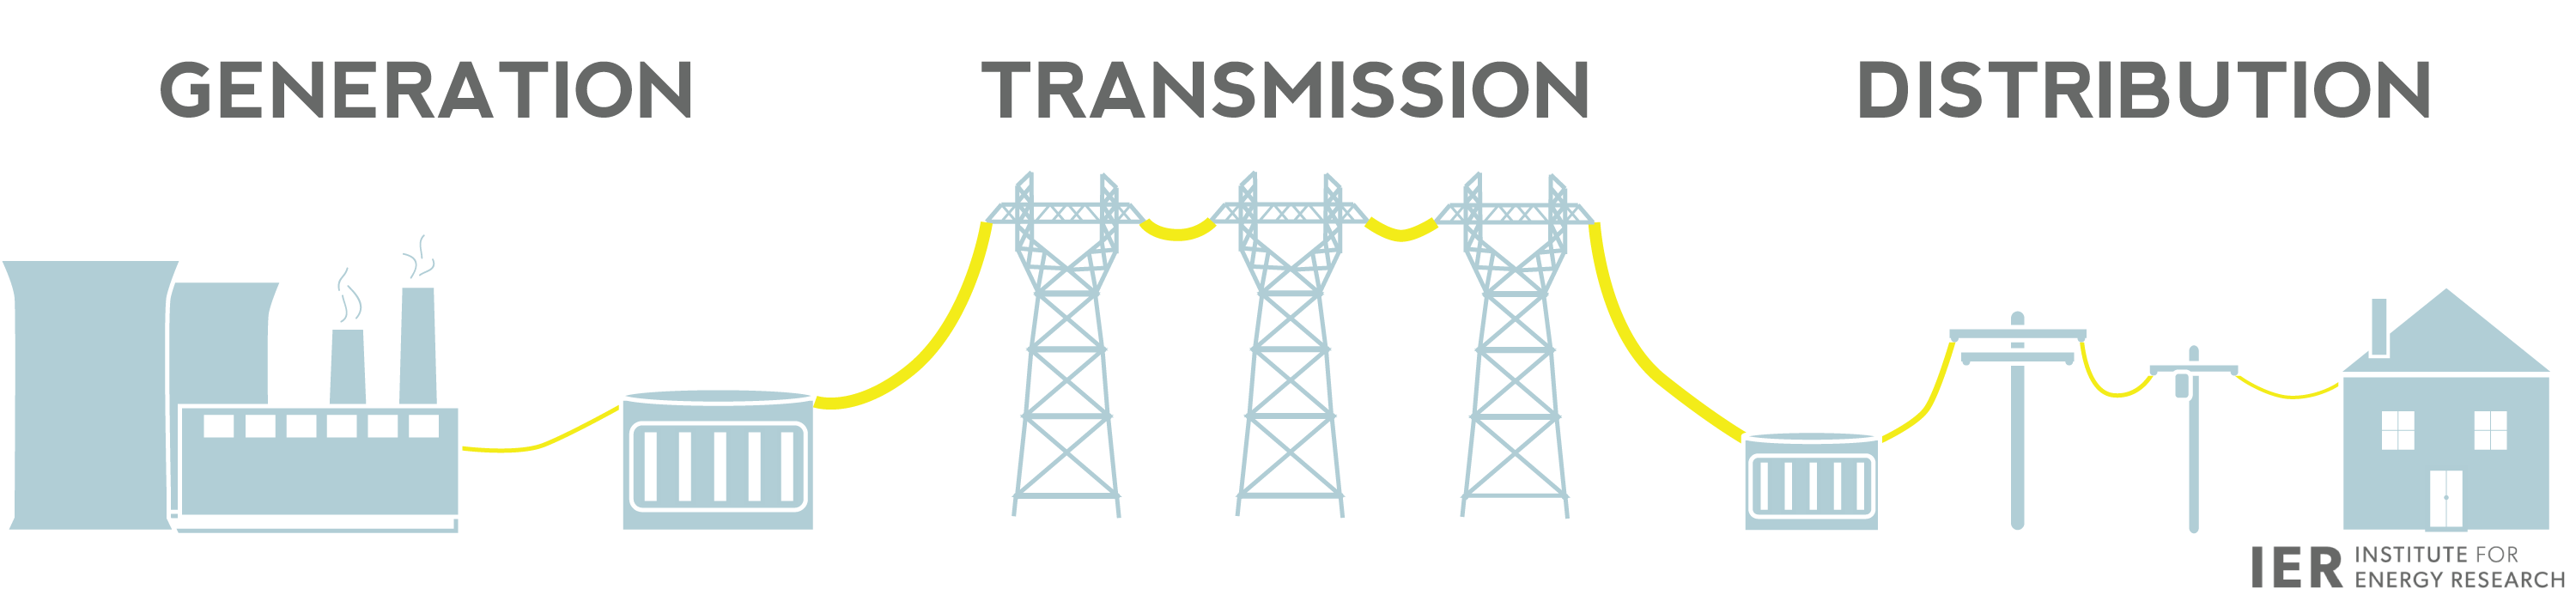
Electricity makes our lives better, brighter, and cleaner. After electricity is generated at a power plant and transmitted on high-voltage power lines, it is then distributed to our homes and businesses on local power distribution lines. This page focuses on electricity distribution—the final stage in electricity delivery. Distribution is the most familiar portion of electricity supply—we see the power lines that run along streets and reach our homes, we pay electricity bills to distribution companies, and we deal with those companies when bad weather knocks out our power. This page tells the story of how electricity distribution has evolved over time and of the innovations that are reshaping how energy is delivered today.
History of Electricity Distribution
In 1882, Thomas Edison built the first electricity distribution system in the U.S. This system carried power from his Pearl Street Station in lower Manhattan to a few customers in the immediate area (within about one square mile). Given the generator’s proximity to the people using power, distributing the electricity from Pearl Street was a small operation compared to the large distribution grids of today. But because it was America’s first grid (Edison had opened a similar plant earlier in 1882 in London), many of the components had to be invented. Edison’s electricity-related work in 1882 motivated his biggest year ever for patents—he completed 106 successful applications in that year alone.[1]
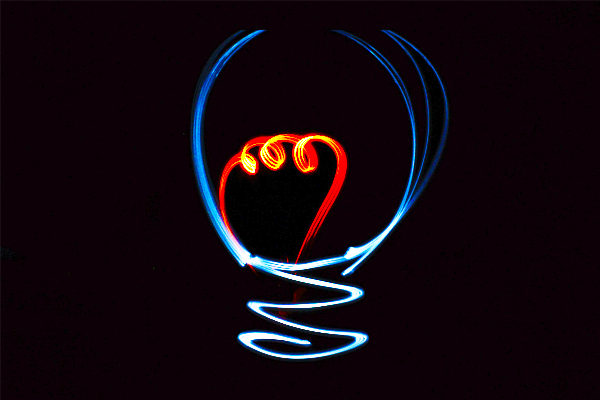
When Edison switched on the power, 52 light bulbs at the New York Times offices glowed for the first time. Awestruck by Edison’s feat, the Times writers described the new incandescent lighting as “soft, mellow, and grateful to the eye…without a particle of flicker to make the head ache.”[2] Edison’s design was revolutionary in that for the first time in history, the energy user was separated from the energy source (and related nuisances and dangers like soot, smoke, and open flame). By replacing the practice of burning candles and lamps, Edison’s distribution system made lighting cleaner, safer, and more pleasant.
The glamour of Edison’s electric light disguised the enormous effort and cost associated with developing the distribution network. The small area of lower Manhattan powered by Pearl Street used 100,000 feet of underground wiring, and the total cost of establishing the station and local distribution network was $300,000 (about $6.8 million in today’s dollars). In fact, Pearl Street didn’t turn a profit until 1884.[3]
Pearl Street inspired other inventors to come up with competing systems. By the late 1880s, Edison’s distribution systems were vulnerable to competition from a more flexible and affordable option designed by Nikola Tesla, George Westinghouse, and others. Edison’s electricity systems used direct current (DC), while Tesla and others promoted the adoption of alternating current (AC) systems, in direct competition with Edison.
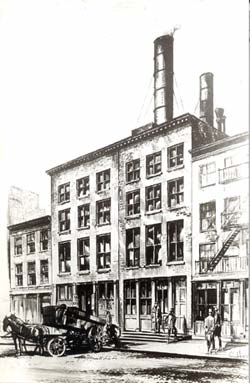
Source: Wikipedia Commons
By the late 1890’s, AC’s many advantages ultimately allowed it to displace DC as the standard for electricity distribution. For example, AC technology allowed power companies to use the same power plant to serve factories that demanded high-voltage power as well as residential customers who demanded low-voltage power. When the Pearl Street station closed in 1895, it had been eclipsed by much larger and more efficient systems—in just 13 years, new developments in the electricity industry made it obsolete.
DC distribution systems are incredibly rare in the U.S. today, but many applications for DC power still exist.[4] For example, many of our electronic devices such as mobile phones and computers run on DC power (hence the need for an AC adapter to convert socket power to DC on its way to the device). Batteries also supply DC, and many transit systems run on a DC-powered third rail.[5] Interestingly, small pockets of DC power grids still exist in some cities including San Francisco, but these areas are still linked to the AC distribution grid (via converters at the edges of the DC distribution system).[6]
How Electricity Distribution Works
Today, the fundamentals of the electricity distribution system are similar to the first AC systems designed by Tesla and Westinghouse. After electricity is generated and moved along the high-voltage transmission system, it comes off the transmission grid at local distribution substations where the voltage is reduced or “stepped down” by special equipment called transformers. This process can take electricity of up to 765,000 volts and step it down to levels under 50,000 volts.[7] The distinction between transmission and distribution lines is not a hard and fast rule, but, generally speaking, distribution lines tend to have voltages below 50,000.
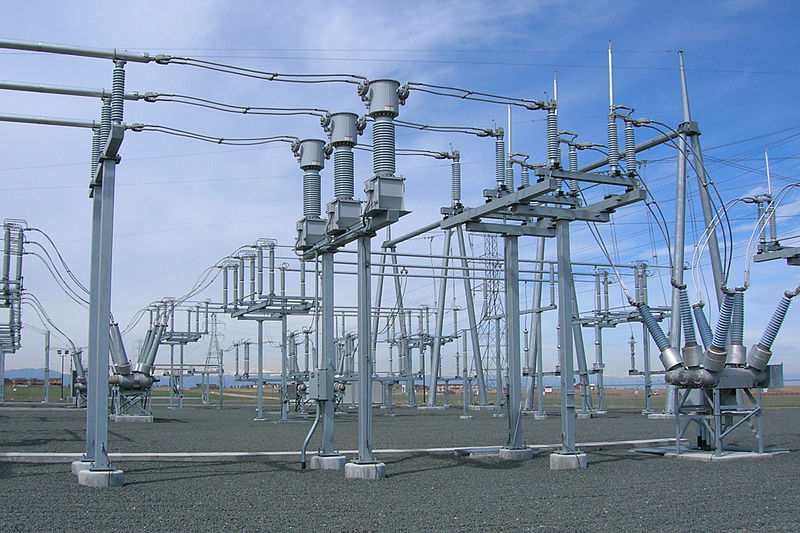
A substation near Denver takes power from the transmission grid and delivers it to the city. Source: Wikipedia Commons
How do transformers change electricity from high voltage to low? A transformer has two cores, each wrapped in copper wiring, with an electromagnetic field passing between them. When entering the transformer, the power travels through a core with many winds of copper wiring surrounding it. As it leaves the transformer, it passes the other core with many fewer winds, resulting in electricity with much less voltage. The concept sounds easy, but high-voltage transformers are a big investment—they each cost millions of dollars and weight hundreds of tons.[8]

Source: Wikipedia Commons
Low voltage electricity can then be distributed through cities and neighborhoods on local distribution power lines.[9] Before the electricity enters houses and business, it is usually stepped down in voltage once again on transformers near the customer (such as the pole-mounted transformers pictured below). For some industrial customers like factories, the voltage may still be relatively high as it reaches its destination, usually between 4,000 and 13,000 volts. The power that reaches most residential and commercial customers, however, comes in at 120 or 240 volts.[10]
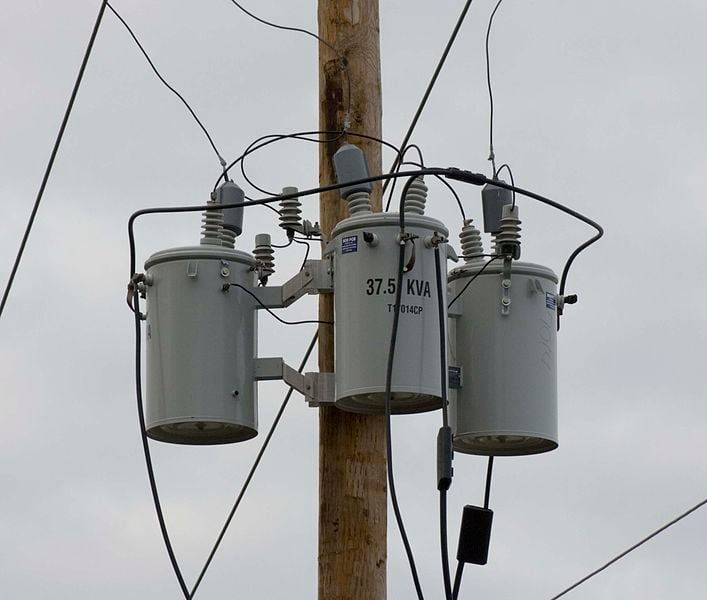
Source: Wikipedia Commons
Metering the Electricity Used by Homes and Businesses
Once the electricity reaches its final destination, it runs through a meter for billing purposes. These meters have traditionally been electromechanical devices that measure the electricity as it passes through, like the one pictured below. Historically, an employee of the distribution company (a so-called meter reader) would come to read how much power had been used during the billing cycle.
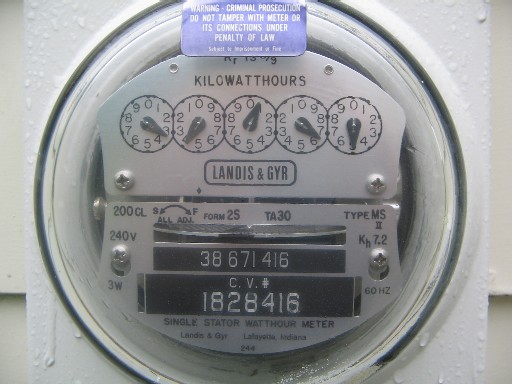
Source: Wikipedia Commons
Today, meters are frequently more high-tech and can communicate with the distribution company without a meter reader going to the trouble of checking each meter individually. These new technologies are commonly referred to as “smart meters.” Smart meters use advances in information technology to allow the various pieces of the power grid (power generators, distributors and consumers) to communicate more effectively and in real time.
Collectively, these technology-enabled communications between different parts of the grid are referred to as the “smart grid.” As electric utilities convert analog features to digital, the grid is becoming smarter and allowing for new types of communication. For example, the smart grid allows customers with smart meters to change their consumption patterns (if they choose) by reacting to real-time prices in the wholesale power market.[11] It also allows power companies to better detect grid abnormalities or outages. However, replacing the existing infrastructure with a “smarter” one is expensive and can make the grid more susceptible to cyber security threats.[12]

What Happens When the Power Goes Out?
While the electrical grid is incredibly reliable, there are times when it fails. A key distinction to draw when discussion power outages is the difference between blackouts that are region-wide (transmission-related) and those that are localized (distribution-related). Blackouts that affect whole regions are rare in the U.S., but distribution systems are disrupted much more often.[13] This can occur when overhead lines contact trees, extreme weather events like wind and ice physically damage power lines, or when wildlife make contact with certain components.[14]
According to the Annual Blackout Tracker recorded by Eaton Corporation, there were 3,236 reported power outages in 2013 totalling over 89 days of outage time. The average blackout lasted 197 minutes , and a majority of them were a result of weather incidents and falling trees.[15] With digital technology, utilities are now better able to monitor the status of the grid in real time, correct problems quickly, and avoid outages by curtailing power.[16]
Why not bury power lines underground to avoid outages? As the following chart from the Energy Information Administration shows, converting distribution lines from overhead to underground is incredibly expensive. Even in new systems, the cost of burying lines underground can be five to ten times that of building overhead lines.
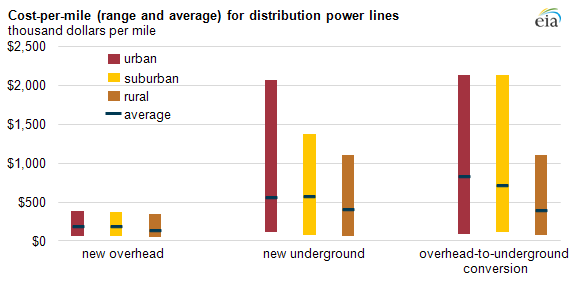
Source: Energy Information Administration
The Economics of Electricity Distribution
Distribution is essentially the retail end of the electricity business. Currently, distribution makes up roughly 32 percent of the total cost of electricity—out of the 9.9 cents/kilowatt-hour (kWh) that Americans paid for electricity on average in 2012, distribution accounted for about 3.1 cents/kWh.[17]
Retail Regulation
Early in the electrification of the U.S., state-level public utility regulators were concerned that electricity companies would use their near-monopoly power to exploit consumers. In response, regulators extended the reach of public utility commissions to regulate electric utilities in the same way they had regulated existing industries such as railroads. The same regulatory bodies created in the late 19th and early 20th centuries are still in place today.[18]
Most often, a state Public Utility Commission (PUC) establishes a maximum rate that power companies are allowed to charge their customers based on the cost of providing electricity. PUCs also scrutinize costs incurred by distribution companies under a “prudence” test before the costs can be recovered. Periodically, PUCs review existing rate structures or the underlying costs and make changes to ensure that the utilities remain viable while minimizing sharp rate increases.[19]
Retail Competition
Seventeen states and the District of Columbia now allow electricity customers to buy from competitive retail suppliers rather than the standard distribution company. This concept is known as retail competition or retail choice. The power sold by competitive suppliers still flows on the lines owned by the distribution company, but retail competition allows customers the choice to contract with a third-party supplier for power sold on the same infrastructure.[20]
These competitive suppliers often provide an array of service options, such as plans that hedge against price fluctuations or promote energy efficiency. Before entering a new market, competitive retail suppliers have to first seek approval from public utility commissions.[21] In 2010, competitive retail suppliers provided 16 percent of U.S. retail sales.[22] The majority of customers who take advantage of competitive retail suppliers are in the commercial and industrial sectors, with the northeastern states, the mid-Atlantic states, and Texas leading the charge.[23] Overall, retail competition has had mixed results—some attribute rate increases to new retail choice policies, while others reject that argument.[24]
Distributed Generation
A recent shift in the economics of the distribution grid is the rise of distributed generation. Traditionally, we think of electricity being generated at a large power plant and sent over high-voltage transmission lines. This model—centralized generation—is the standard of electricity generation around the world. Distributed generation, in contrast, is smaller in scale and is located on-site. In the past, the biggest source of distributed generation was “cogeneration” facilities that produce steam for some industrial use but can also “co-generate” electricity with steam as well.
In recent years, smaller home or business-based distributed generation has become more popular as people install solar panels on their homes and businesses. Today in the U.S., more than 90 percent of all distributed generation comes from solar power.[25] Once installed, these panels essentially convert a home or business into a small power plant generating a portion of its own electricity while the sun is out. Most distributed generation facilities are still connected to the grid in order to have reliable access to electricity around the clock (at night or while clouds pass).
Net Metering
Any power produced by on-site generators can be used by the customer or cogeneration facility. If there is more electricity generated than is used on-site or in the home, that power can travel back through the meter and onto the distribution grid, providing power in those moments for other local customers. Customers feeding electricity back to the grid can present unique challenges for grid operators trying to manage supply and demand efficiently. For example, in cases such as Hawaii’s, unwanted solar energy that utilities are forced to take may add too much energy to an already-taxed system, increasing the risk of voltage spikes.[26]
Aside from the challenges for grid operators in balancing the flow of electricity, utilities also face economic challenges as net metering becomes more widely adopted. Unlike wholesale generators of electricity, which are paid wholesale prices for the electricity they generate, distributed generation customers (i.e. generally customers with solar panels on their homes) are typically paid the full retail rate for the electricity they feed to the grid. For utilities, this means they pay much more for electricity from net metering customers than they do for electricity from power plants. In some cases, utilities pay as much as 300 percent more.[27] When utilities incur these higher costs, they then pass those expenses onto their non-solar customers to ensure they can maintain reliable service.
The Future of Electricity Distribution
Since 2000, the utility industry has invested over $275 billion (2012 USD) on distribution networks.[28] Going forward, investment in new distribution infrastructure through the year 2030 is expected to reach as high as $582 billion.[29] This investment is driven in part by the unavoidable need to replace aging equipment and in part by the push for new “smart” equipment. As with investment levels, residential electricity prices are also rising, with rates in New England, the Mid-Atlantic, the Mountain area, the South Atlantic, and the East North Central accounting for the highest jump in rates.[30] In fact, U.S. retail residential prices for the first half of 2014, at 12.3 cents/kWh, increased 3.2 percent from the same time in 2013, the highest year-to-year increase during the first half of the year since 2009.
Net Metering Policies
Currently, 43 states and the District of Columbia have adopted formal net metering policies. While there is some variation, customers are generally reimbursed for the electricity they supply back to the grid at the full retail rate, when utilities could purchase power from local power plants at wholesale prices. But most customers do not supply power to the grid, and this cost shift from net metering customers to others (generally from solar users to non-solar users) has driven discussions on reforming net metering policies nationwide. Finding a fair way to address these issues going forward is essential for promoting long-term equity and reliability in the power grid.
Demand-Side Management (DSM)
Electricity may be the one industry in which suppliers actively encourage customers to use less of their product, and that is partly due to demand-side management (DSM) policies. DSM policies such as energy efficiency laws encourage or force utilities to sell less electricity, particularly during peak hours when electricity use and electricity prices are highest.[31]
DSM policy also plays a role in the Environmental Protection Agency’s (EPA’s) recently proposed power plant regulations. EPA administrator Gina McCarthy, in her testimony during a Senate hearing on the power plant regulations, said, “What we’re projecting is that consumers will see a lowering of their energy bills, and that’s because we’re getting waste out of the system…it’s the cheapest, most effective way to get these reductions—to get more efficient.”[32]
Critics of DSM point out two fundamental problems: 1) DSM policies start with a false premise—they assume everyone uses too much electricity to begin with, which is impossible to know for each individual household, and 2) DSM policies fail to accomplish their stated goals—as the Institute for Energy Research has previously noted, energy efficiency mandates can have a “rebound effect.” That is, people increase their use of energy-consuming technologies as they become more efficient, which undermines the initial goal of using less energy.[33]
Conclusion
Thanks to the work of innovators like Thomas Edison and George Westinghouse, we have a robust electricity distribution system today, but we must continue to work to make sure our electricity is reliable and affordable for future generations of Americans. That starts with an appreciation of how far we have come and how fortunate we are to have access to the electricity that powers our lives.
________________________________________________________________________________________________________________________________________
[1] http://edison.rutgers.edu/patents.htm
[2] http://www.pearlstreetinc.com/NYISO_bulk_elect_beginnings.pdf
[3] Institute of Electrical and Electronics Engineers, Pearl Street Station, http://www.ieeeghn.org/wiki/index.php/Pearl_Street_Station
[4] Jennifer Lee, Off Goes the Power Current Started by Thomas Edison, New York Times, November 14, 2007, http://cityroom.blogs.nytimes.com/2007/11/14/off-goes-the-power-current-started-by-thomas-edison/
[5] http://en.wikipedia.org/wiki/List_of_current_systems_for_electric_rail_traction
[6] http://spectrum.ieee.org/energy/the-smarter-grid/san-franciscos-secret-dc-grid
[7] GE Digital Energy, Distribution Feeder Principles, http://www.gedigitalenergy.com/multilin/resource/Feeder/UniFlip_Publication/document.pdf
[8] http://energy.gov/sites/prod/files/Large%20Power%20Transformer%20Study%20-%20June%202012_0.pdf
[9] https://www.cowlitzpud.org/pdf/electricity101/6%20Electricity%20-%20Transmission.pdf
[10] The Cadmus Group, Metered Load Factors for Low-Voltage, Dry-Type Transformers in Commercial, Industrial, and Public Buildings, December 7, 1999, Northeast Energy Efficiency Partnerships Inc. (NEEP), http://www.neep.org/Assets/uploads/files/emv/emv-library/1999-12_Metered_Load_Factors.pdf
[11] https://rrtp.comed.com/about/
[12] http://www.gao.gov/assets/600/592507.pdf
[13] http://www.history.com/news/blackout-the-worst-power-outages-in-history
[14] http://www.nytimes.com/2013/09/01/opinion/sunday/squirrel-power.html?pagewanted=all&_r=0
[15] http://electricalsector.eaton.com/forms/BlackoutTrackerAnnualReport
[16] http://www.cnn.com/2010/TECH/innovation/08/09/smart.grid/
[17] http://www.eia.gov/energyexplained/index.cfm?page=electricity_factors_affecting_prices
[18] http://www.naruc.org/commissions/
[19] http://www.eei.org/issuesandpolicy/stateregulation/Documents/COSR_history_final.pdf
[20] https://www.epsa.org/industry/primer/?fa=sold
[21] https://www.epsa.org/industry/primer/?fa=sold
[22] http://www.eia.gov/todayinenergy/detail.cfm?id=6250
[23] Ibid.
[24] https://www.epsa.org/industry/index.cfm?fa=mythsRealities
[25] http://www.publicpower.org/files/PDFs/Distributed%20Generation-Nov2013.pdf
[26] https://www.instituteforenergyresearch.org/analysis/net-metering-101/
[27] Ibid.
[29] http://www.eei.org/ourissues/finance/Documents/Transforming_Americas_Power_Industry_Exec_Summary.pdf
[30] http://www.eia.gov/todayinenergy/detail.cfm?id=17791
[31] http://www.aceee.org/topics/eers
[32] https://www.instituteforenergyresearch.org/analysis/epas-misleading-pr-power-plant-rules/
