
The Potential Gas Committee recently released its year-end 2014 U.S. natural gas resource base estimate, which totals 2,515 trillion cubic feet—the largest level in its 50-year history and 131 trillion cubic feet above its previous high estimate for 2012. The increase is due to reevaluations of shale gas resources in the Atlantic, Mid-Continent, Gulf Coast and Rocky Mountain areas, and conventional/tight gas resources in the Mid-Continent and Rockies.[i] The shale gas portion of the Potential Gas Committee’s estimate totals 1,253 trillion cubic feet–about 61 percent of the nation’s total traditional potential resources–up from a 57 percent share in 2012. Adding in the Energy Information Administration’s estimate of proved dry gas reserves of 338 trillion cubic feet brings the total U.S. natural gas resource estimate for the Potential Gas Committee to 2,853 trillion cubic feet—161 trillion cubic feet higher than its 2012 assessment. At current levels of consumption, the Potential Gas Committee’s assessment indicates that the United States has over 100 years supply of natural gas.
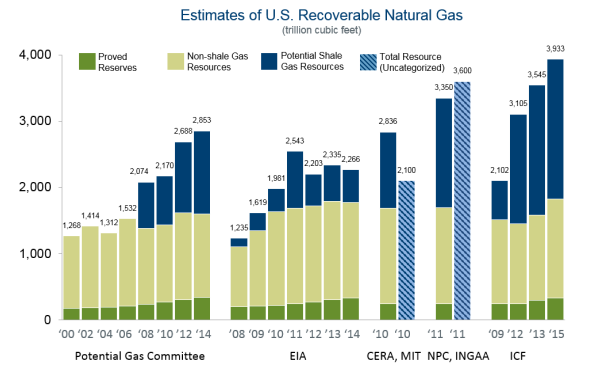
The Potential Gas Committee is not the only organization that estimates the resource base for natural gas. The following chart compares the resource base estimates from a number of organizations, including the Energy Information Administration, which generally bases its estimates on those of the U.S. Geological Survey in the U.S. Department of Interior. The 2014 estimates from industry, academia and government show a natural gas resource range of 2,266 to 3,933 trillion cubic feet with the Energy Information Administration at the low end and ICF International at the high end. ICF estimates that over 1,500 trillion cubic feet of natural gas is available at $5 per million British thermal Unit (Btu) or less.[ii]
The Potential Gas Committee Assessment
The Potential Gas Committee’s year-end 2014 assessment of 2,515 trillion cubic feet includes 2,357 trillion cubic feet of natural gas potentially recoverable from traditional reservoirs (conventional, tight sands and carbonates, and shales) and 158 trillion cubic feet in coalbed reservoirs. Compared to its year-end 2012 assessment, traditional resources increased by 5.9 percent, and coalbed gas resources declined by 0.1 percent, resulting in a net increase in total potential natural gas resources of 5.5 percent.
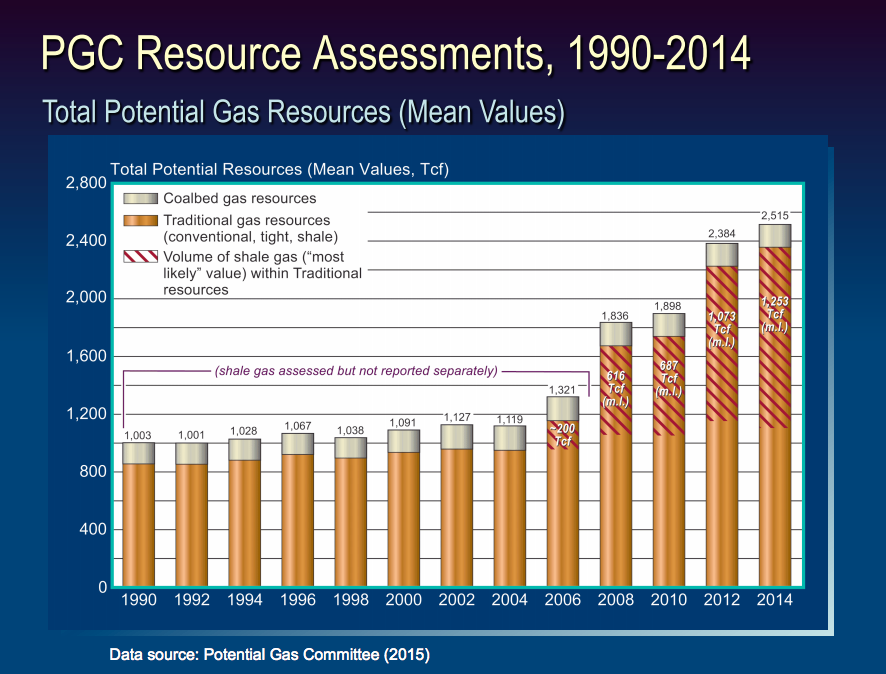 Source: Potential Gas Committee, http://potentialgas.org/download/pgc-press-release-april-2015-slides.pdf
The Atlantic area ranks as the nation’s richest resource area with 35 percent of total U.S. traditional resources, followed by the Gulf Coast (including the Gulf of Mexico) with 23 percent, the Rocky Mountains with 18 percent, and the Mid-Continent area with 12.5 percent. Changes in the most recent assessment from the previous one in 2012 were primarily due to analyses of recent drilling, well-test and production data from these four regions. The largest volumetric and percentage gains were reported for Appalachian shale basins, primarily the Marcellus but also the Utica and the newly assessed Rogersville Shale, which together increased by 137 trillion cubic feet or 24 percent.
Gulf Coast assessments increased by 15 trillion cubic feet (3 percent), and reflects continued aggressive development of wet gas and condensate in the Eagle Ford Shale of the Texas Gulf Coast basin and a first-time assessment for the Cretaceous Tuscaloosa marine shale in Louisiana. Mid- Continent assessments increased by 26.9 trillion cubic feet (10 percent), due mainly to substantially higher evaluations of the Barnett Shale in the Fort Worth basin and the Bone Spring and Wolfcamp plays in the Permian basin. The Rocky Mountain assessments increased by 9.6 trillion cubic feet (2.3 percent), resulting from reevaluation of new data and drilling results from the Cretaceous Niobrara shale play in western Colorado’s Piceance basin and the Niobrara fractured-carbonate play in the Denver basin.
Natural Gas Production
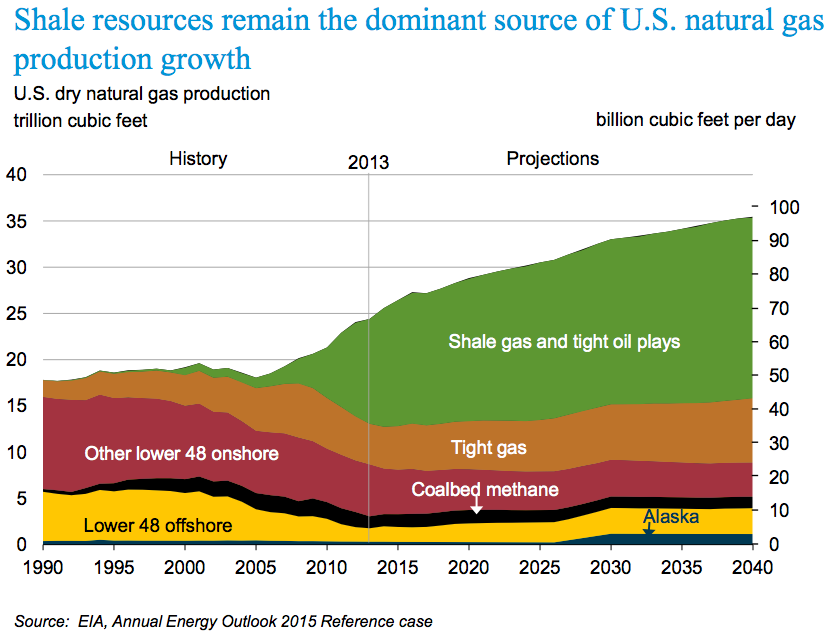
In 2014, dry natural gas accounted for 30 percent of total U.S. energy production and the Energy Information Administration expects it to continue to be the largest contributor to total U.S. energy production through 2040. Natural gas production has increased rapidly in recent years. From 2008 to 2014, dry natural gas production increased from 20.2 trillion cubic feet to 25.7 trillion cubic feet. The Energy Information Administration expects it to increase to 35.45 trillion cubic feet in its Annual Energy Outlook 2015. The strongest growth in natural gas production occurs in the Marcellus Shale and Utica Shale formations in the east, followed by the Gulf Coast, and the Dakotas/Rocky Mountains region.[iii]
 Source: Energy Information Administration, http://www.eia.gov/pressroom/presentations/sieminski_04142015.pdf
Not long ago, energy experts expected the United States would become a major importer of natural gas. The shale revolution has virtually eliminated the need for natural gas imports, particularly for liquefied natural gas (LNG), and the Energy Information Administration now projects the United States will be a net natural gas exporter by 2017. In the Annual Energy Outlook 2015, the United States transitions from a net importer of 1.2 trillion cubic feet of natural gas in 2014 to a net exporter of 5.6 trillion cubic feet in 2040. LNG exports reach 3.3 trillion cubic feet in 2030 and remain at that level through 2040, accounting for over 50 percent of total U.S. natural gas exports.
Conclusion
Technology has brought about the shale gas revolution in the United States with hydraulic fracturing and horizontal drilling technology combining to make the United States the number one natural gas producer in the world. Instead of needing to import natural gas to meet our domestic needs, which many thought would be the case not long ago, the United States is expected to be a net exporter of natural gas by 2017. The latest resource estimate from the Potential Gas Committee shows that the United States has over 100 years of natural gas available at current usage levels.
But, it is not our government’s policies that has brought about these production and resource increases. According to the Congressional Research Service, natural gas production on federal lands has declined by 31 percent over the past five years, while production on private and state lands has increased by 37 percent.[iv] Our federal government likes to take credit for the production increases that the oil and gas industry has made possible, but federal government red tape and excessive permit approval times has turned producers toward private and state lands that are under the jurisdiction of state and local governments.[v]
[i]Potential Gas Committee, Potential Gas Committee Reports Significant Increase in Magnitude of U.S. Natural Gas Resource Base, April 8, 2015, http://potentialgas.org/press-release
[ii] American Natural Gas Alliance, Carpe Diem: LNG Exports Are America’s Once-in-a-Generation Opportunity, April 2015, http://anga.us/media/blog/95340C74-5056-9F69-D496534F93D45850/files/ANGA%20-%20Carpe%20Diem%20-%20LNG%20Exports.pdf
[iii] Energy Information Administration, Annual Energy Outlook 2015, April 14, 2015, http://www.eia.gov/forecasts/aeo/pdf/0383(2015).pdf
[iv] Congressional Research Service, U.S. Crude Oil and Natural Gas Production in Federal and Non-Federal Areas, April 3, 2015, https://www.instituteforenergyresearch.org/wp-content/uploads/2015/04/CRS-federal-vs.-nonfederal.pdf
[v] Institute for Energy Research, Oil and Natural Gas Booms on State and Private Lands, April 14, 2015, https://www.instituteforenergyresearch.org/analysis/oil-and-natural-gas-production-booms-on-private-and-state-lands-plummets-on-federal-lands/
