
According to the BP Statistical Review of World Energy, natural gas consumption increased more than any other fuel in 2018, increasing its global share by a percentage point to 24 percent. Natural gas consumption increased 5 percent and accounted for almost 45 percent of global energy demand growth. Global oil and coal consumption each increased by over 1 percent, nuclear by 2 percent, hydroelectric by 3 percent, and non-hydro renewables by 14.5 percent—below the average growth rate of the past decade of 16.4 percent. Despite the large percentage growth in non-hydro renewables, its share was just 4 percent of the global energy market—the same as in 2017—and far less than the 85-percent share of fossil fuels. In 2018, the increase in wind and solar capacity flattened out at around 150 gigawatts. Coal’s share of the primary energy market fell to 27 percent—its lowest level in fifteen years, but still almost 7 times the market share of non-hydro renewables.
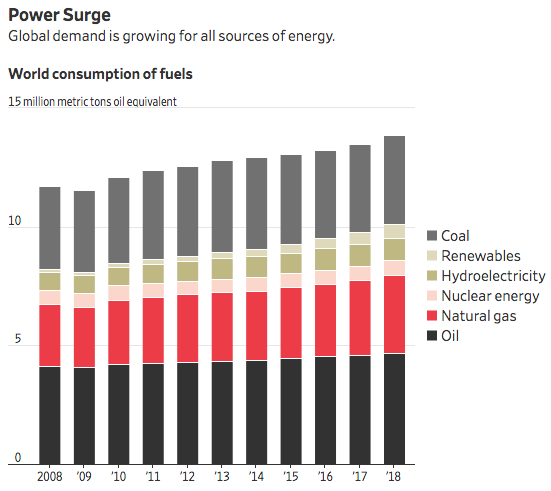
Global Energy Demand
Global energy demand increased by 2.9 percent last year—the fastest since 2010 and almost double its 10-year average of 1.5 percent per year. Carbon dioxide emissions increased by 2 percent in 2018—the fastest growth for seven years—which made BP point out that “there is a growing mismatch between societal demands for action on climate change and the actual pace of progress.” Carbon dioxide emissions increased by around 0.6 gigatons—roughly equivalent to the emissions released by increasing the number of passenger cars by a third.
Surging global energy demand fueled increases in production, despite an increase in global oil and natural gas prices and a slowing of economic growth. U.S. oil and gas production increases in 2018 were the largest annual increases ever recorded by any country due to U.S. ingenuity in producing oil and gas from shale basins.
Some of the stronger-than-expected growth in demand was due to weather that increased air conditioning and heating use, particularly in China, the United States and Russia. BP found that weather effects in these countries could account for around a quarter of the increase in energy consumption in 2018. Another factor in the growth in primary energy consumption was China’s cyclical pattern of demand in the consumer and service-facing sectors versus the more energy-intensive iron and steel sectors. The strength in the latter helped increase global primary energy consumption.
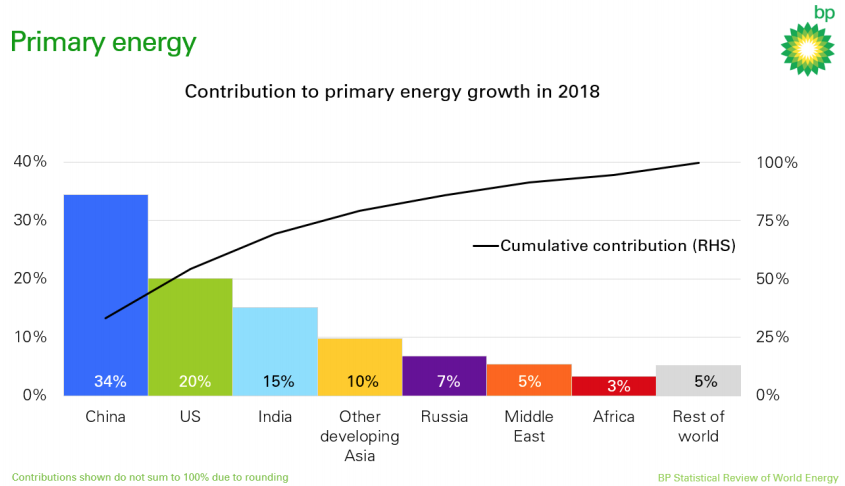
China, the United States and India together accounted for more than two thirds of the global increase in energy demand.
China
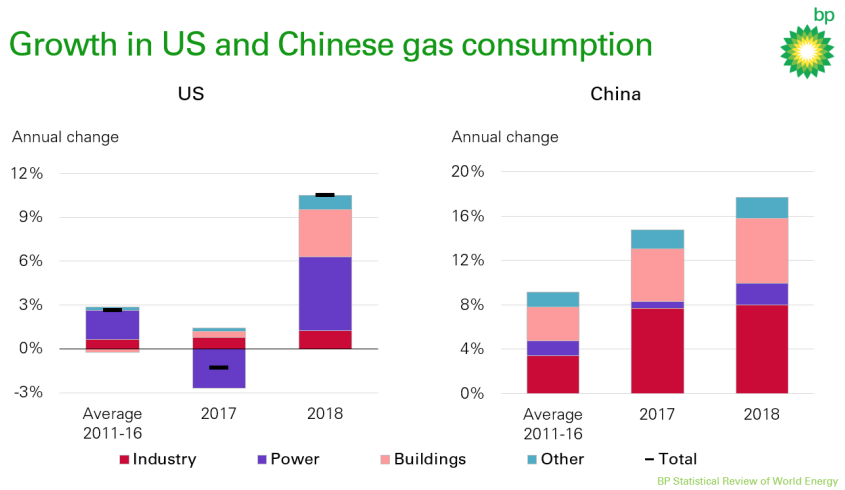
China also had a large increase in energy use—4.3 percent—with natural gas consumption increasing 18 percent as China increased its consumption of natural gas in most sectors. China’s natural gas consumption increased by more than one-third over the past two years. China accounted for over half of the increase in world LNG imports. Nonetheless, China’s coal consumption also increased—by 1 percent. China increased its oil consumption by 5 percent, nuclear consumption by 19 percent, hydroelectric by 3 percent, and non-hydroelectric renewables by 29 percent. China accounted for almost three quarters of the global growth in nuclear power.
United States
Energy consumption in the United States increased by 3.5 percent in 2018—its fastest rate in 30 years—with oil consumption at 20.5 million barrels a day and natural gas consumption at 817 billion cubic meters. About half of the U.S. increase in natural gas demand was from the electricity sector. The growth of natural gas demand in the United States in 2018 was about equal to the entire natural gas consumption of the United Kingdom. Oil consumption in the United States increased 2 percent in 2018, natural gas consumption by 10.5 percent, and non-hydroelectric renewables by almost 10 percent. All other fuels were flat or decreasing in 2018.
India
India’s primary energy consumption grew 7.9 percent in 2018, with the largest fuel increase from coal. India’s coal consumption increased 8.7 percent in 2018—faster than its average 10-year growth rate of 5.7 percent. India and China together accounted for the vast majority of the gains in both consumption and production of coal. China and India together accounted for around two thirds of the increase in power demand. Besides coal, India also increased its consumption of other fuels—oil by 5 percent, natural gas by 8 percent, nuclear 4 percent, hydroelectric by 3 percent, and non-hydroelectric renewables by 27 percent.
Key Minerals
For the first time in their annual statistical report, BP included an assessment of “key minerals for the changing energy system”—rare earth minerals, cobalt, lithium, graphite. Because of government mandates and subsidies, non-hydro renewables are growing and BP saw the need to assess the state of the key minerals that are essential for those energy sources. This is an acknowledgment of the need for policymakers to begin to take note of the state of world supplies of those minerals upon which these new sources depend.
Conclusion
In 2018, primary energy consumption increased at the fastest rate since 2010 and was accompanied by a 2-percent increase in carbon dioxide emissions. Consumption grew in part due to weather effects and to a change in China’s pattern of consumption toward increased iron and steel. Natural gas was the fuel of choice with the largest increase in consumption. Non-hydroelectric renewables had the largest percentage increase in consumption, but wind and solar capacity increases flattened out at 150 gigawatts. World economic growth stimulates energy consumption, and 2018 was a good year for both.
