
BP has changed focus because its new CEO Bernard Looney has set out ambitious plans for the oil company to switch toward non-carbon energy, with plans to decrease its oil and gas production by at least 1 million barrels per day, or 40 percent, over the next decade. This change is reflected in its Energy Outlook 2020, which assumes that a carbon tax is global policy in all of its main three scenarios:
- Business-as-usual (BAU) assumes that government policies, technologies and societal preferences continue to evolve in a manner and speed seen in the recent past.
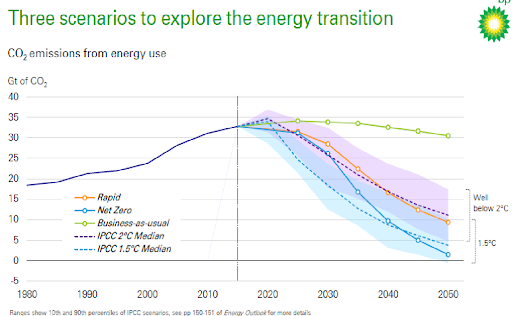
- Rapid assumes the introduction of policy measures, led by a significant increase in carbon prices. The scenario is broadly consistent with limiting the rise in global temperatures by 2100 to well below 2°C above pre-industrial levels.
- Net Zero assumes the policy measures of the Rapid scenario are reinforced by significant shifts in societal and consumer behavior and preferences–such as greater adoption of circular and sharing economies and switching to low carbon energy sources. This scenario is broadly consistent with limiting temperature rises to 1.5°C.
Both the Rapid and Net Zero scenarios assume a significant increase in carbon prices, reaching $250 per metric ton of carbon dioxide in the developed world by 2050 and $175 per metric ton in emerging economies. The tax is lower in the BAU scenario, with carbon prices reaching $65 and $35 per metric ton of carbon dioxide by 2050 on average in developed and emerging economies, respectively.
Impact of COVID-19
The BP Outlook 2020 assumes that the scale of the economic cost and disruption from COVID-19 is likely to have a significant and persistent impact on the global economy and energy system. The central view in the scenarios is that economic activity partially recovers from the impact of the pandemic over the next few years as restrictions are eased, but that some effects persist. The level of global GDP is assumed to be around 2.5 percent lower in 2025 and 3.5 percent in 2050 as a result of the pandemic. The economic impacts disproportionately affect emerging economies, such as India, Brazil and Africa, whose economic structures are most exposed to the economic ramifications of COVID-19.
The pandemic may also lead to a number of behavioral changes; for example, people may choose to travel less, switch from using public transport to other modes of travel, or work from home more frequently. While, many of these behavioral changes are likely to dissipate over time as the pandemic is brought under control and public confidence is restored, some changes, such as increased working from home, may persist.
In the Rapid scenario, the impact of the pandemic is assumed to reduce the level of energy demand by around 2.5 percent in 2025 and 3 percent in 2050. The impacts are most pronounced on oil demand, which is expected to be around 3 million barrels per day lower in 2025 and 2 million barrels per day in 2050 as a result of the pandemic. The majority of this reduction reflects the weaker economic environment, with around 1 million barrels per day of the reduction in 2025 a result of the various behavioral changes. The impacts in the other scenarios are similar.
The Global Economy
The world economy is expected to continue to grow over the next 30 years, driven by increasing wealth and living standards in the developing world, but at a slower rate than in the past. Global GDP annual growth is expected to average around 2.6 percent (on a 2015 Purchasing Power Parity basis) in all three scenarios. This growth is considerably slower than its average over the past 20-years, in part reflecting the assumed persistent impact of Covid-19 on economic activity. The weaker economic growth is also due to the assumed increasing impact of climate change on the productive potential of the economy.
The expansion in global activity is supported by population growth, with the world’s population expected to increase by over 2 billion people to around 9.6 billion by 2050. But the most important factor underpinning global growth is assumed increasing productivity (GDP per head) – and hence prosperity (income per head) – which drives around 80 percent of the expansion in global GDP over the Outlook. Developing economies are expected to account for over 80 percent of the growth in the world economy, with China and India contributing around half of that increase.
The growth in global activity and prosperity is underpinned by assumed continuing high levels of urbanization, which is often an integral part of the development process leading to increasing levels of industrialization and productivity. Countries which are projected to have a relatively fast pace of urbanization over the next 30 years— that is, the level of urbanization is projected to increase by at least a third by 2050— are expected to contribute over half of the increase in world output over the Outlook, despite making up less than a third of global GDP in 2018.
Primary Energy Demand
Primary energy is expected to increase by around 10 percent in the Rapid and Net Zero scenarios and around 25 percent in the BAU scenario. The average rates of growth of primary energy in Rapid (0.3 percent per year) and Net Zero (0.3 percent per year) are significantly slower than the past 20 years (2.0 percent per year), reflecting a combination of weaker economic growth and faster improvements in energy intensity (energy used per unit of GDP). Growth of primary energy in the BAU scenario (0.7 percent per year) is faster and more sustained than in the other two scenarios, reflecting slower gains in energy efficiency.
Faster declines in energy intensity relative to history in the Rapid and Net Zero scenarios are a major factor in mitigating the growth in carbon emissions. Other things being equal, if energy intensity over the Outlook improved at the same rate as the past 20 years, carbon emissions by 2050 would be more than a quarter higher in both the Rapid and Net Zero scenarios.
Liquid Fuels Demand
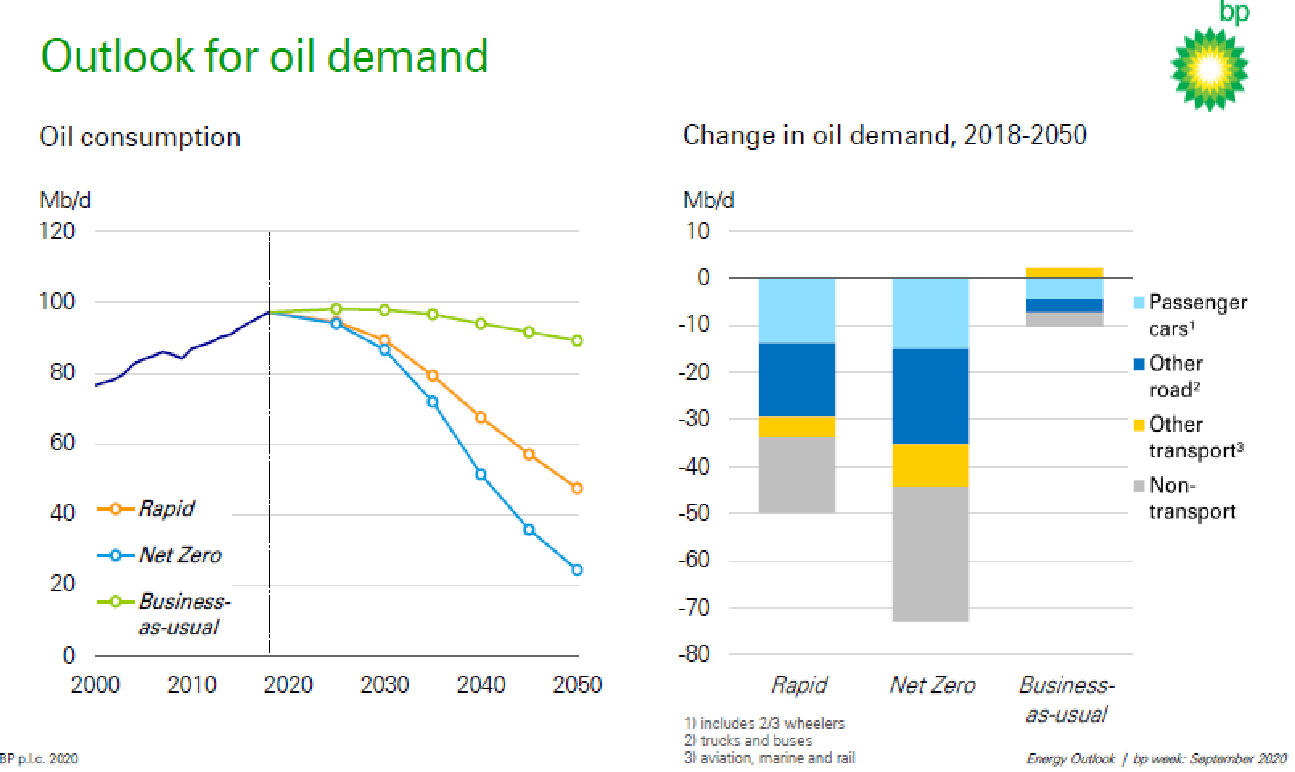
Global liquids demand in all three scenarios is significantly affected by the impact of Covid-19, which disproportionately impacts economic activity and prosperity in emerging economies which are the main growth markets for liquid fuels. The experience of coronavirus also triggers some lasting changes in behavior, especially increased working from home. As a result, liquids fuel demand in these scenarios is mostly influenced by the assumptions in the transport sector. In the BAU scenario, liquids fuels demand is fairly stable in the transport sector supporting global demand at around 100 million barrels per day for most of the next 20 years, and then edges lower in the final 10 years of the Outlook as the use of liquid fuels within the transport sector begins to decline.
Liquids demand in the Rapid and Net Zero scenarios does not fully rebound from the near-term hit to demand from COVID-19 and is expected to fall substantially over the Outlook to around 55 million barrels per day and 30 million barrels per day by 2050, respectively. In these scenarios, transport sector demand is expected to decline sharply due to increasing efficiency and electrification of road transportation. The transport sector accounts for around two-thirds of the decline in the use of liquid fuels by 2050 in the Rapid scenario and almost 60 percent in the Net Zero scenario. The large decline in liquids demand in the second half of the Outlook—where it is expected to fall by an average of over 2 million barrels per day per year in the Rapid scenario and 3 million barrels per day in the Net Zero scenario—is unprecedented and has significant implications for other parts of the oil industry, including refining.
The non-combusted use of liquid fuels, largely as a feedstock in the petrochemicals sector, is expected to increase in both the Rapid and BAU scenarios, and is expected to decline below 2018 levels only in the final 10 years of the outlook in the Net Zero scenario.
Natural Gas Demand
In the Rapid scenario, the global demand for natural gas including biomethane is expected to recover from the near-term dip associated with COVID-19 and grow relatively robustly over the next 15 years or so, driven primarily by economies in developing Asia (China, India, etc.) as they switch away from coal towards lower carbon fuels, including gas. Global gas consumption is expected to decline in the subsequent 15 years as the impetus from developing Asia fades, compounded by increasing declines in the developed world, such that global gas demand by the end of the Outlook falls back close to its 2018 levels.
The growth of global gas demand in the Net Zero scenario is shorter-lived, expected to peak in the mid-2020s, followed by a far faster decline, such that demand by 2050 is around 35 percent below 2018 levels.
In contrast, gas demand increases throughout the next 30 years in the BAU scenario, increasing by a third by 2050. This growth in gas consumption is expected to be relatively widespread, with particularly strong increases across developing Asia, Africa and the Middle East.
Renewable Energy
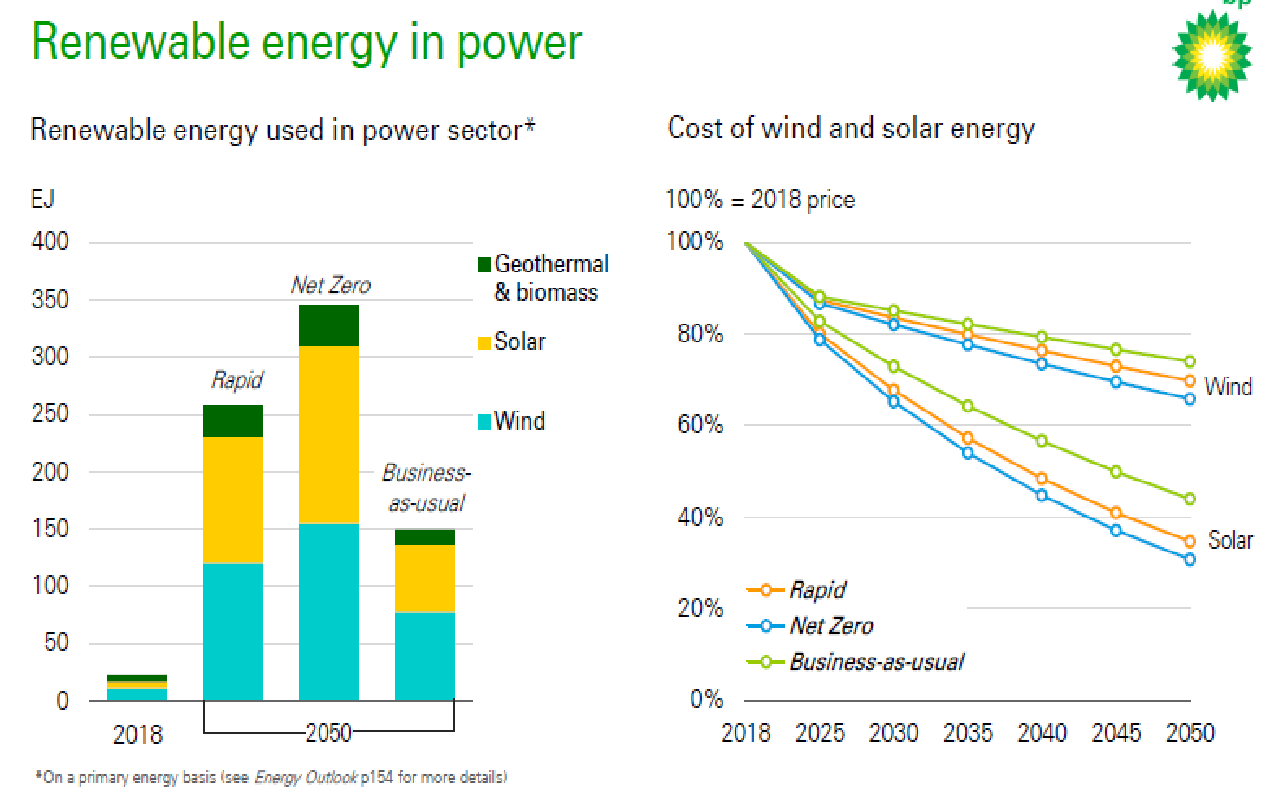
Renewable energy used in the power sector—wind, solar, biomass and geothermal—is expected to grow quickly in all three scenarios, due to assumed declining costs of production and policies encouraging a shift to lower carbon energy sources. The expansion of renewable energy in power in the Rapid and Net Zero scenarios far outpaces the growth of primary energy, increasing around five and seven times greater than the overall increase in primary energy. The fast pace of growth is expected to ease slightly from the late 2030s onwards as the costs of balancing the intermittency associated with adding increasing amounts of wind and solar power rise. The share of renewables in primary energy is expected to grow from around 5 percent in 2018 to 45 percent by 2050 in the Rapid scenario and 60 percent in the Net Zero scenario.
The growth in renewable energy is dominated by wind and solar power due to assumed declines in development costs. Over the next 30 years, wind and solar costs are assumed to drop by around 30 percent and 65 percent in the Rapid scenario, respectively and by 35 percent and 70 percent in the Net Zero scenario. In both the Rapid and Net Zero scenarios, wind and solar power account for similar absolute increases in power generation with a faster rate of expansion in solar power, supported by the assumed greater cost declines for solar.
The growth of renewables in the power sector is less fast in the BAU scenario, although they are still expected to grow seven-fold and contribute around 90 percent of the growth in primary energy over the Outlook.
In all three scenarios, emerging economies are expected to account for the majority of the growth in renewable energy, driven by stronger growth in power generation and by the increasing share of renewables in power generation.
Carbon Dioxide Emissions
Carbon emissions from energy use in the Rapid scenario are expected to decline by about 70 percent by 2050, which is in the middle of the range of “well below 2-degree” scenarios contained in the 2019 IPCC Report. In the Net Zero scenario, carbon emissions are expected to fall by over 95 percent from their 2018 levels. The initial pace of decline is slower than the range of IPCC “below 1.5-degree” scenarios, but by the second half of the Outlook the emissions pathway in this scenario is close to the middle of the IPCC range. In the BAU scenario, carbon emissions are expected to peak around the mid-2020s and decline only gradually, falling to around 10 percent below 2018 levels by 2050.
Conclusion
The BP Outlook 2020 is a radical departure from other forecasts in that it assumes a global carbon tax in all three of its main scenarios and a lasting impact from COVID-19, particularly affecting the transport sector, which does not fully recover in its outlook due partly to behavioral changes. This Outlook is even a major departure from BP’s forecast last year where its base-case “Evolving Transition” scenario expected global liquids demand to hold steady at 108 million barrels per day to 2040, after peaking in 2035. In July, the head of the International Energy Agency, Fatih Birol, said he “would not be surprised” if global oil demand fully recovers to over 100 million barrels per day after the coronavirus pandemic is brought under control.
Compared to last year’s outlook, BP’s renewable energy’s share of global energy in 2040 is expected to be 7 percentage points higher, due to higher-than-expected contributions from bioenergy, wind and solar power, supported by “green” hydrogen production and assumed large cost declines. This is achieved despite grid stability issues with high levels of intermittent technologies (wind and solar) and the need for substantial infrastructure for refueling stations for electric vehicles.
Somehow, BP manages to assume major global changes, but yet ends up forecasting a growing global economy, lower carbon emissions, and energy availability.
