
From the BP Statistical Review of World Energy, the following are some details on global carbon dioxide (CO2) emissions between 2005 and 2020 (the most recent year available):
- Between 2005 and 2020, global CO2 emissions from energy grew by 14 percent (3885 million metric tons)
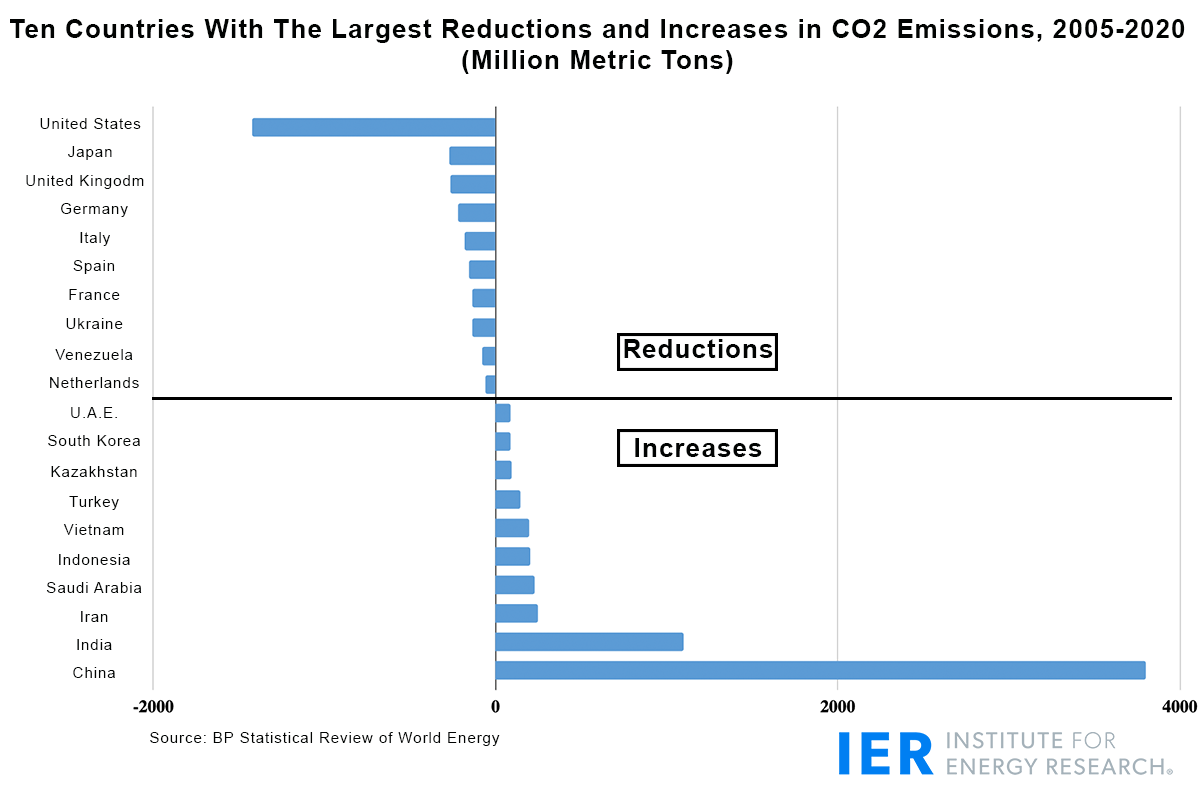
- Declines in CO2 emissions between 2005 and 2020 were led by the United States (-24 percent and 1423 million metric tons). Annual CO2 emissions in the United States declined 10 times during this period.
- The next largest decline was in Japan (-21 percent and 268 million metric tons).
- The largest increase in carbon dioxide emissions between 2005 and 2020 came from China (62 percent and 3801 million metric tons). China was one of only two countries (the other was Iran) where CO2 emissions increased between 2019 and 2020—both by less than 1 percent.
- In 2020, China emitted 23 percent more CO2 emissions (9899 million metric tons) than the United States and all the European nations combined (8054 million metric tons).
- The next highest increment between 2005 and 2020 came from India where emissions rose by 92 percent (1100 million metric tons).
- Together, China and India accounted for 26 percent more CO2 emissions (4901 million metric tons) than the total world increase in global carbon dioxide emissions (3885 million metric tons). China alone accounted for 98 percent of the total increase in global CO2 emissions.
- The Asia Pacific region that includes China and India emitted 44 percent more CO2 emissions (5590 million metric tons) than the global CO2 emissions total of 3885 million metric tons between 2005 and 2020.
