
The Center for Disease Control and Prevention published the chart, below, to demonstrate the increasing prevalence of asthma in the United States in the 1980s and early 1990s and the stubborn persistence this century.
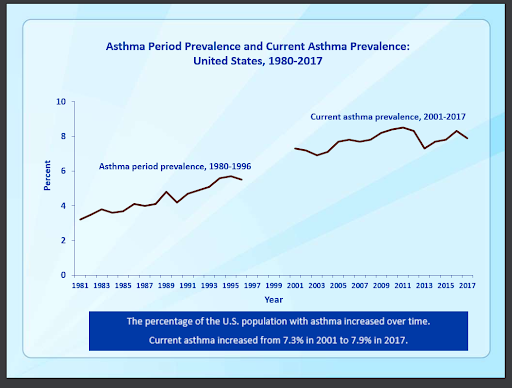
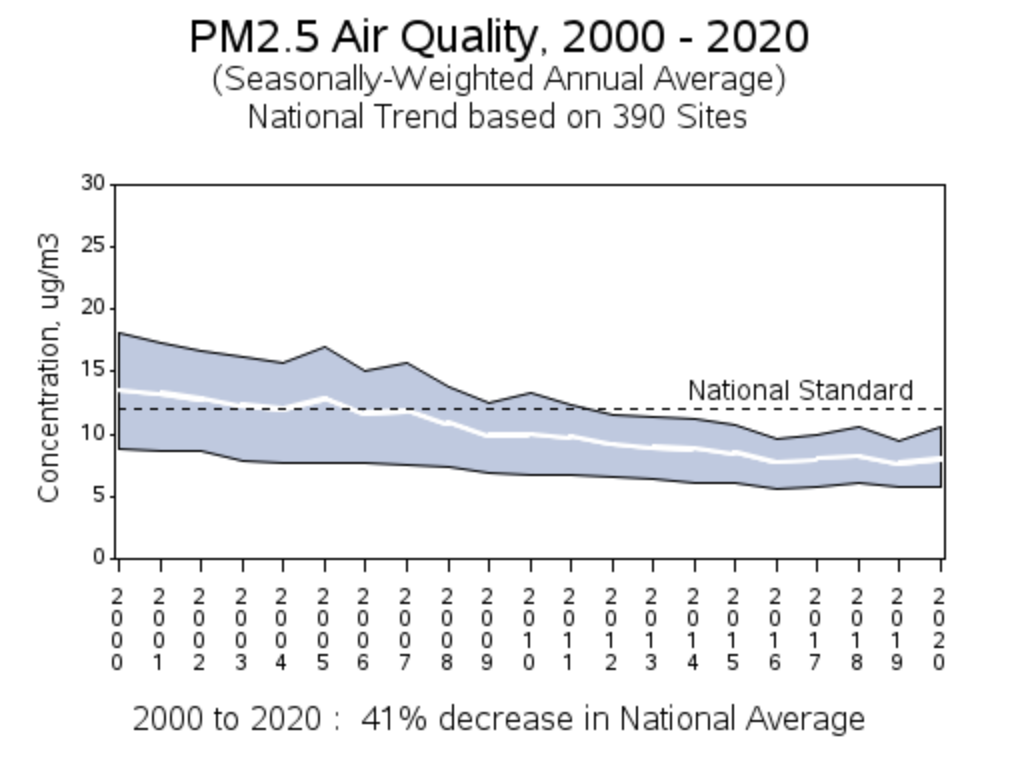
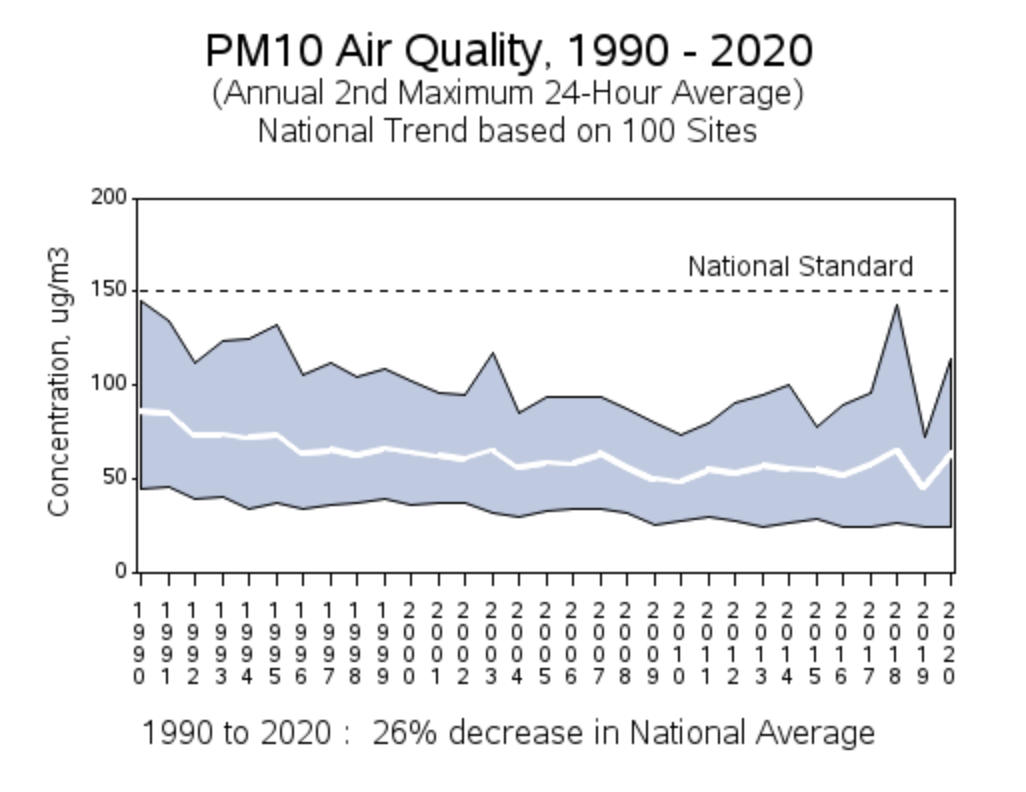
Though some studies link asthma to particulate matter and call for increasingly strict controls on emissions, the trends above show an almost inverse link. Like most real pollution, particulate emissions (PM10 and the finer PM2.5) dropped significantly over this whole period and most dramatically during the same time that asthma prevalence increased the fastest.
The next two charts, from US EPA, show the ambient level of PM2.5 dropped 41% over the period 2000 to 2020, while the ambient level of PM10 dropped 26% over the period 1990 to 2020.
These ambient levels include contribution from both natural sources (such as dust and sea salt) and manmade sources. These manmade emissions have dropped significantly for at least the past forty years. The EPA provides the evidence in the table below.
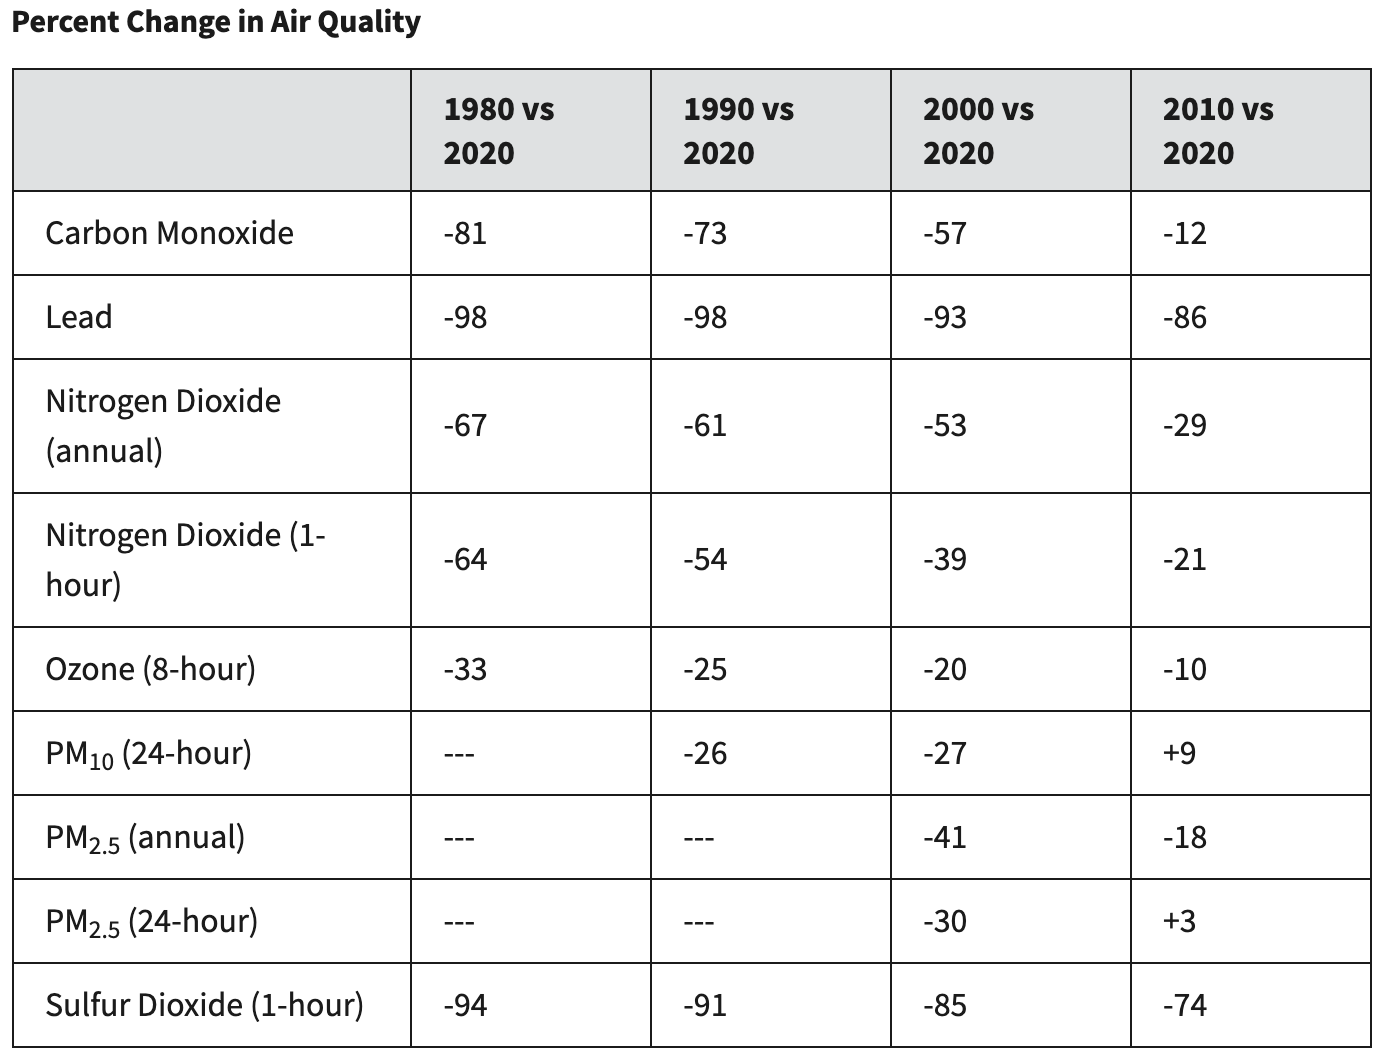
Every decade shows a significant drop in particulate matter emissions, as well as emissions of other pollutants. A chart from the same EPA webpage shows that these combined emissions dropped 73% even as the economy, population, miles driven, and energy use rose significantly.
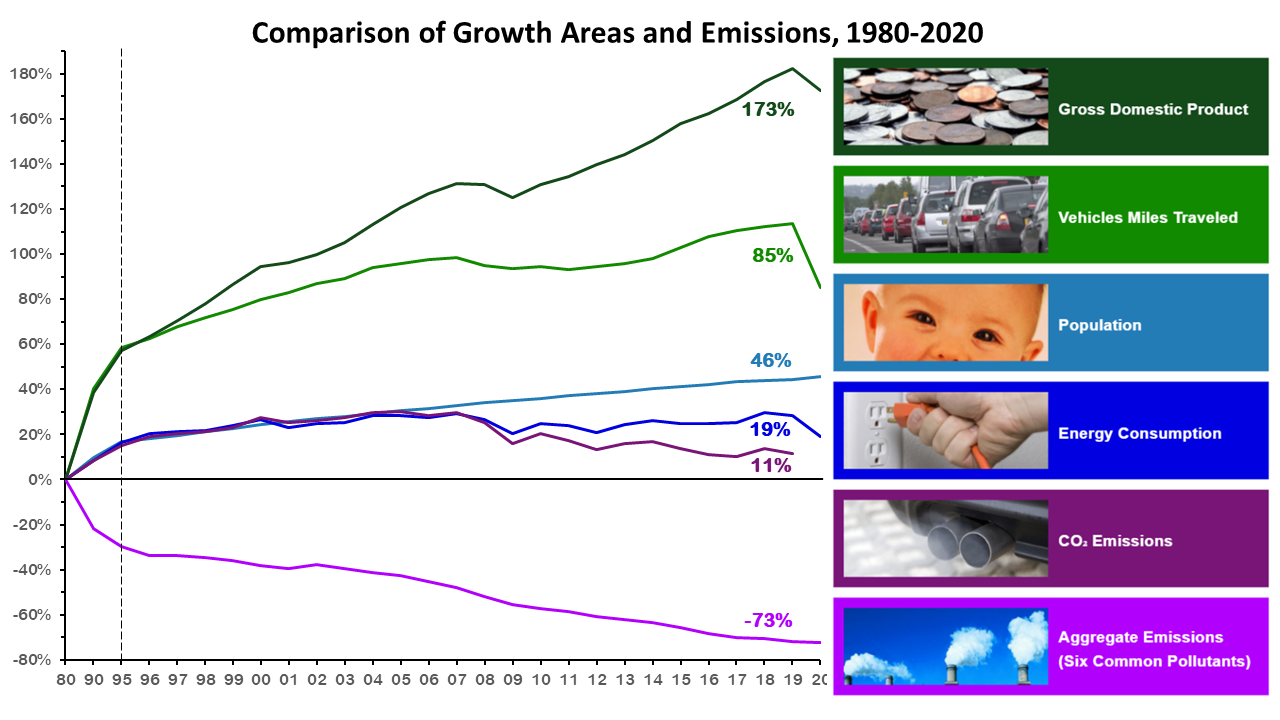
Of particular interest for the asserted asthma connection, the drop in emissions was greatest for the period that saw the most rapid increase in asthma prevalence. Using the broadest measures shows asthma prevalence rose while particulate emissions fell, undercutting the argument that increase in asthma is caused by manmade emissions of particulate matter.
