
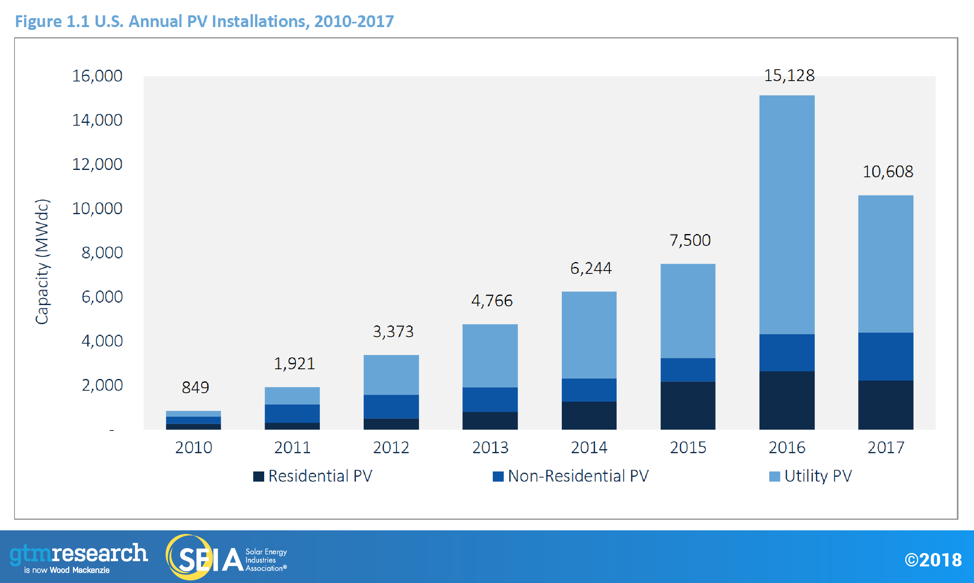
The U.S. solar industry installed 30 percent less generating capacity in 2017 than in 2016—4.6 gigawatts less capacity. According to the U.S. Solar Market Insight Report 2017 Year-In-Review, 10.6 gigawatts of solar capacity were installed in 2017 compared to 15.2 gigawatts in 2016, making total U.S. solar photovoltaic (PV) capacity in 2017 53.3 gigawatts. In 2016, developers completed projects ahead of their original schedules due to the expectation that the federal solar tax credit would expire. Solar panel demand has been increasing over the past decade due to government policies that support solar energy and lower prices for solar technologies. These policies include a mix of tax credits, renewable portfolio standards (mandates that utilities produce or purchase a certain percentage of their electricity from renewable sources), net-metering, and other mechanisms.
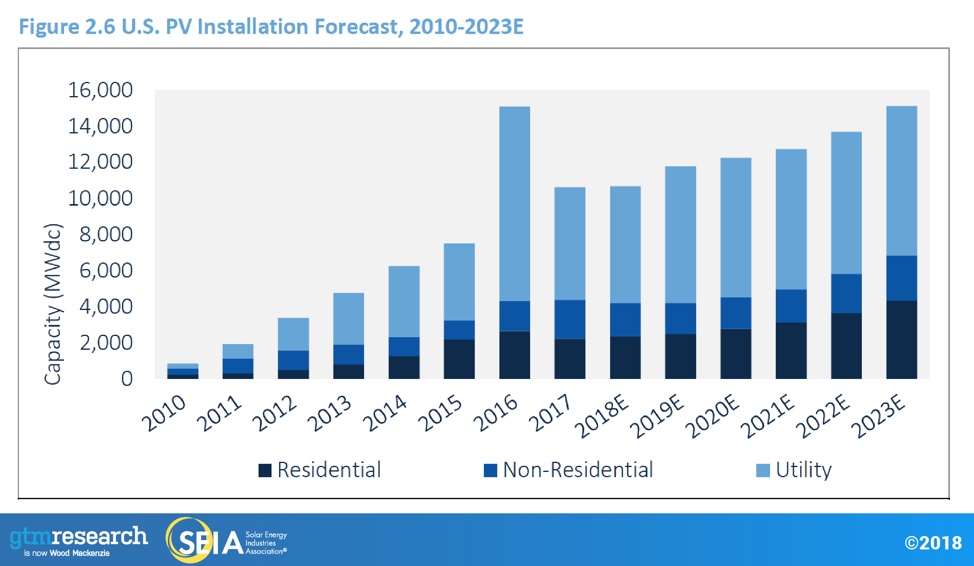
The Solar Market Insight Report based on a study by GTM Research for the Solar Energy Industries Association also predicts that installations between 2018 and 2022 will be 13 percent lower than originally forecast due to U.S. tariffs on panel imports and new federal tax laws. GTM Research does not expect U.S. solar installations to hit the peak level of 2016 (15.2 gigawatts) again until 2023. (See chart below.)
In January, President Trump approved recommendations to impose tariffs on imported solar cells and modules as well as imported washing machines. The tariff for solar cells and modules will last for four years. In year one it will be 30 percent, and will then decrease by 5 percent each year, reaching 15 percent in 2021. Based on current pricing trends, the 30 percent tariffs will result in about a $0.10/Watt increase in year 1 module prices.
Source: Solar Energy Industries Association
In 2018, the United States is expected to install a similar level of solar capacity as in 2017 due to higher prices stemming from the tariffs. When prices increase, solar projects will either wait out the tariffs that caused the price increase or be shelved.
Lower corporate tax rates resulting from the tax overhaul passed by Congress last year will also affect solar installations. The tax overhaul will lower the demand for tax equity financing where banks and others invest in solar projects to claim the 30 percent tax credit for solar, offsetting their tax bills. The tax equity market represents a major financing mechanism for solar projects.
Solar Capacity by Sector
The utility market for solar panels decreased the most of any sector in 2017. A total of 6,234 megawatts of solar capacity was added by utilities in 2017. Lower-than-expected installation volumes occurred in the second half of 2017 due to delays and consequent spillover of projects into 2018 because of the uncertainty of tariffs being imposed, as well as delays and cancellations of PURPA projects in markets such as Idaho and Montana. Large utility solar projects are the most vulnerable to tariffs because modules represent up to half the cost of the project.
The utility market for solar is expected to grow slightly in 2018 and 2019, but remain relatively flat between 2020 and 2022. Two gigawatts are already in construction for 2018, and GTM Research expects over 6.4 gigawatts of new PV capacity to come online in the utility sector in 2018. The uncertainty surrounding the possibility of tariffs caused at least 10 percent of the pipeline in the second half of 2017 to be delayed, and in some cases to spill over into 2018, which has led to 351 megawatts of additional projects in development for 2018.
The residential PV market fell 16 percent in 2017 due to weakness in California and major Northeast markets, which have been impacted by pullback from some national installers that no longer have rapid expansion strategies. Total installed capacity in residential markets in 2017 was 2,227 megawatts.
The non-residential sector grew 28 percent in 2017 due to regulatory demand pull-in from policy deadlines in California and the Northeast, and to the continued build-out of a solar pipeline in Minnesota. Total installed capacity in non-residential distributed markets in 2017 was 2,149 gigawatts.
The majority of the installed capacity in 2017 is attributed to the utility sector (59 percent), while distributed solar accounted for 41 percent of installations.
Source: Solar Energy Industries Association
Solar Installations by State
California remains at the top of the state ranking for solar installations with a total of 19.8 gigawatts, having installed 2.6 gigawatts in 2017. North Carolina ranks second in total installations with a total of 4.3 gigawatts. North Carolina added 1.2 gigawatts of solar PV in 2017. Florida ranked third in solar additions in 2017, having installed 749 megawatts last year. Florida, however, ranks just tenth in total PV capacity with 1,355 megawatts. Arizona and Nevada rank third and fourth in total installations.
Conclusion
Solar PV installations were down in 2017 and up in 2016 due to the expectation that the solar investment tax credit would expire. Clearly, government policies affect the amount of solar capacity that is added each year. According to GTM Research, the Trump administration tariffs and tax overhaul will affect future solar PV installations and the phase out of the solar investment tax credit will also have an effect as already seen in 2016.
