
The Energy Information Administration (EIA) just released its Annual Energy Outlook 2014 with projections through 2040. Although there is a major push by the Obama Administration to make renewable energy the fuel of choice, fossil fuels supply 80 percent of the nation’s energy in 2040, slightly less than their 82 percent share in 2012. Renewable energy increases its share from 9.3 percent in 2012 to just 11.8 percent in 2040 despite the subsidies and mandates that they receive.
Oil Production
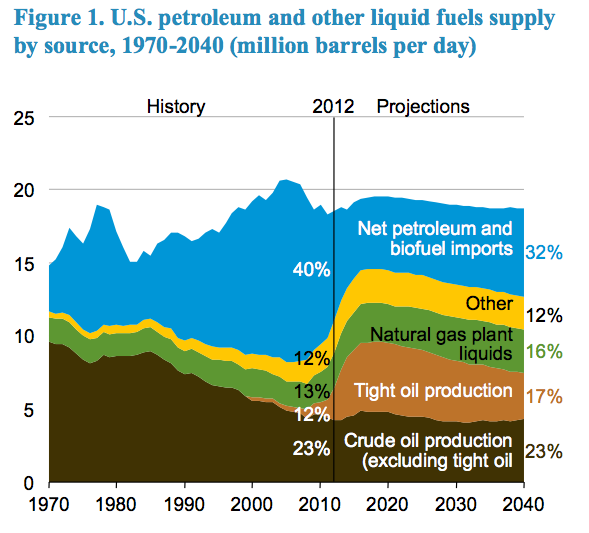
EIA projects that the production of crude oil and lease condensate will increase from 6.5 million barrels per day in 2012 to 9.6 million barrels per day in 2019, 22 percent higher than in last year’s forecast, as producers locate and target the sweet spots of plays currently under development and find additional tight formations that can be developed with the latest technologies. After 2019, domestic crude oil production declines, but remains at or above 7.5 million barrels per day through 2040. Tight oil production increases from 2.3 million barrels per day in 2012 (35 percent of total crude oil production) to 4.8 million barrels per day in 2021 (51 percent of the total). Tight oil production declines after 2021, as more development moves into less-productive areas. Offshore crude oil ranges between 1.6 and 2.0 million barrels per day from 2015 through 2040, as the pace of development activity quickens and new, large development projects, predominantly in the deepwater and ultra-deepwater portions of the Gulf of Mexico, are brought into production.
Source: Annual Energy Outlook 2014, http://www.eia.gov/forecasts/aeo/er/early_production.cfm
Petroleum Imports
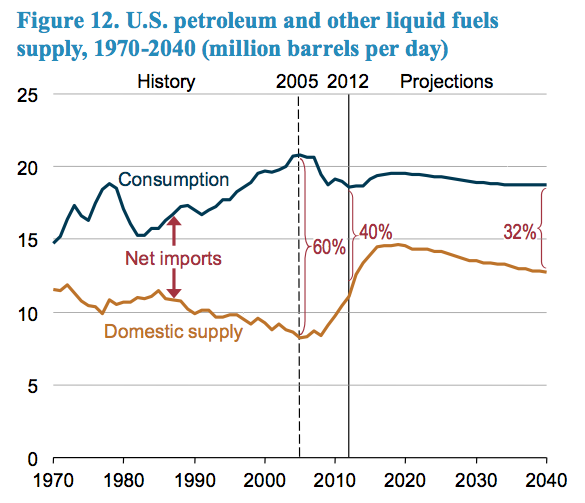
Increasing domestic oil production results in decreasing imports of petroleum and other liquid fuels. Imported petroleum represented 60 percent of consumption in 2005 and decreased to 40 percent in 2012. The net petroleum import share is expected to continue to decline to 25 percent in 2016 and then to rise to 32 percent in 2040 due to the decline in domestic tight oil production in 2022.
Source: Annual Energy Outlook 2014, http://www.eia.gov/forecasts/aeo/er/early_production.cfm
Natural Gas Production
Dry gas production increases from 24 trillion cubic feet on 2012 to 37.5 trillion cubic feet in 2040 due to continued growth in shale gas production resulting from horizontal drilling and hydraulic fracturing. Shale gas production increases from 9.7 trillion cubic feet in 2012 to 19.8 trillion cubic feet in 2040.
Drilling in less-productive but still-profitable areas in tight oil, shale oil, and natural gas formations occurs at the end of the forecast period due to natural gas prices increasing above $6 per million Btu. Lower 48 offshore natural gas production fluctuates between 1.7 trillion cubic feet and 2.9 trillion cubic feet. The increase in offshore production is due to 15 new deepwater projects that came on line in 2012.
Source: Annual Energy Outlook 2014, http://www.eia.gov/forecasts/aeo/er/early_production.cfm
Natural Gas Imports and Exports
EIA expects the United States to become a net exporter of liquefied natural gas (LNG) in 2016 and an overall net exporter of natural gas in 2018 due to increased use of LNG in foreign markets, strong domestic production, and low U.S. natural gas prices relative to other global markets. Exports of LNG from new liquefaction capacity are expected to surpass 2 billion cubic feet per day by 2020 and increase to 3.5 billion cubic feet per day in 2029. Pipeline imports from Canada decline through 2033, and then increase through 2040. Pipeline exports to Mexico increase by more than 400 percent, which require additional pipeline infrastructure to be added between the two countries.
Coal Production
EIA expects coal production to increase from 1,016 million short tons (20.6 quadrillion Btu) in 2012 to 1,121 million short tons (22.6 quadrillion Btu) in 2040. Coal production declined by more than 7 percent in 2012, down from 1,096 million short tons in 2011, due to competition from natural gas in electricity markets and onerous regulations from the Environmental Protection Agency causing premature retirements of coal-fired power plants. EIA expects coal production to recover to 1,062 million short tons by 2015, in response to rising natural gas prices and a moderate increase in electricity demand. But, the retirements of coal-fired generating capacity due to MATS results in another drop in coal production to 1,022 million short tons in 2016. Coal production then increases gradually to 1,127 million short tons in 2030 where it stabilizes. U.S. coal exports are expected to increase from 126 million short tons in 2012 to 161 million short tons in 2040.
Electricity Generation
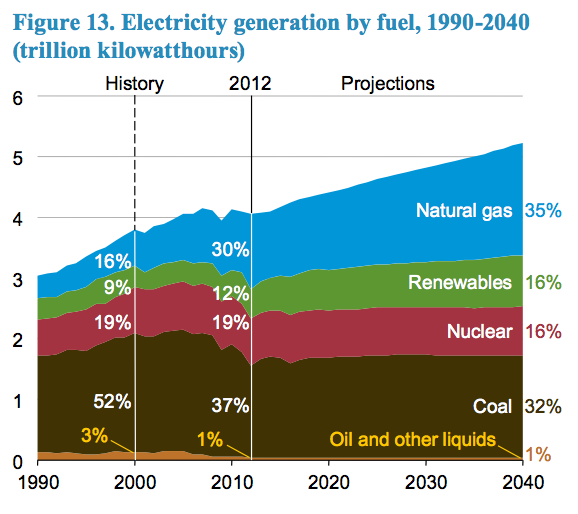
EIA expects electricity consumption to increase from 3,826 billion kilowatt hours in 2012 to 4,954 billion kilowatt hours in 2040. Coal consumption by electric generators is dampened due to slow growth in electricity demand, competitively priced natural gas, programs encouraging renewable fuel use, and the implementation of new environmental rules. Natural gas fired capacity and generation increase due to retirements of coal and nuclear plants and because new natural gas-fired plants are much cheaper to build than coal, nuclear, or renewable plants. EIA assumes implementation of the Clean Air Interstate Rule (CAIR) as a result of an August 2012 federal court move to vacate the Cross-State Air Pollution Rule and the implementation of the Mercury and Air Toxic Standards (MATS) in 2016. Once MATS is in place, sulfur dioxide levels are reduced to well below the levels required by CAIR, and mercury emissions decline from 30.8 tons in 2011 to 6.1 tons in 2016.
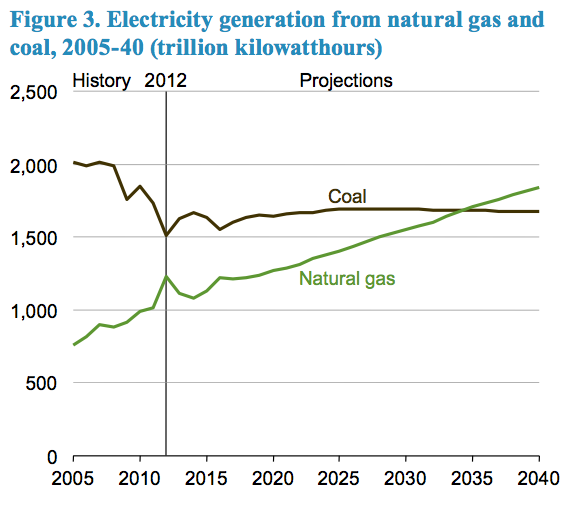
Coal-fired electricity generation has traditionally been the largest component of electricity generation, representing 37 percent of total generation in 2012. EIA expects natural gas generation to surpass coal generation after 2035. In 2035, they both have a 34 percent share of the market. In 2040, EIA expects the coal share to fall to 32 percent and the natural gas share to increase to 35 percent. Market concerns about greenhouse gas emissions due to proposed regulations from the EPA dampen the expansion of coal-fired capacity additions. As coal-fired plant retirements outpace new capacity additions, coal-fired generating capacity is expected to decline from 310 gigawatts in 2012 to 262 gigawatts in 2040, a drop of more than 15 percent.
Source: Annual Energy Outlook 2014, http://www.eia.gov/forecasts/aeo/er/executive_summary.cfm
Electricity generation from nuclear power plants increases by 5 percent, from 769 billion kilowatt hours in 2012 to 811 billion kilowatt hours in 2040. Its share of electricity generation falls, however, from 19 percent in 2012 to 16 percent in 2040. Nuclear generating capacity decreases from 102 gigawatts in 2012 to 98 gigawatts in 2020 despite new construction of 5.5 gigawatts and uprates at existing plants of 0.7 gigawatts. The increases in nuclear capacity are more than offset by nuclear retirements in regions where existing nuclear units are facing challenging economic conditions due to low natural gas prices and merchant plant economics. After 2025, a small amount of new nuclear capacity comes on line as natural gas prices increase, and by 2040, nuclear capacity increases to its 2012 level–102 gigawatts.
Increased generation from non-hydroelectric renewable power accounts for 28 percent of the growth in electricity generation between 2012 and 2040. Generation from renewable resources increases due to federal tax credits, state-level policies, and federal requirements to use more biomass-based transportation fuels, some of which can produce electricity as a byproduct of their production processes. In the final decade of the projection, however, renewable generation growth is driven by increasing cost competiveness with other nonrenewable technologies.
Due to energy provisions of the American Taxpayers’ Relief Act, which extends several tax credits for utility-scale renewables and redefines the qualification criteria, more construction of wind-powered generating capacity is expected in the near term than in last year’s EIA forecast. Non-hydroelectric renewable energy consumption in the electric power sector grows from 1.9 quadrillion Btu in 2012 to 4.5 quadrillion Btu in 2040, with biomass accounting for 27 percent of the growth, wind 39 percent, and solar 7.5 percent. Growth in renewable generation in the forecast also results from state Renewable Portfolio Standards and regulations on carbon dioxide emissions in California. The share of electricity generation coming from all renewable fuels increases from 12 percent in 2012 to 16 percent in 2040.
Source: Annual Energy Outlook 2014, http://www.eia.gov/forecasts/aeo/er/early_elecgen.cfm
Energy Consumption
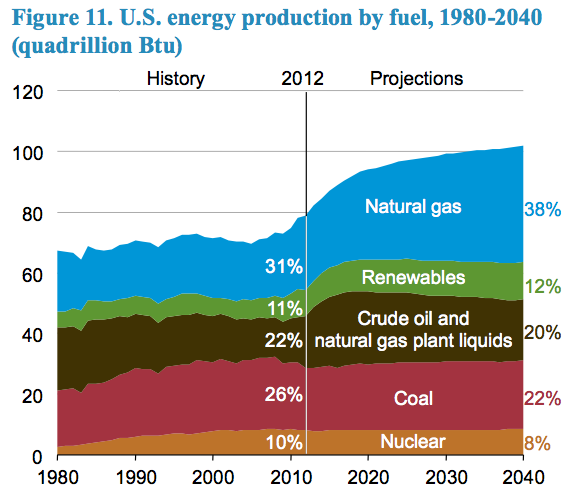
Primary energy consumption increases from 95 quadrillion Btu in 2012 to 106 quadrillion Btu in 2040—an increase of 12 percent. The fossil fuel share of energy consumption declines slightly from 82 percent in 2012 to 80 percent in 2040.
Consumption of petroleum and other liquids declines slightly from 35.9 quadrillion Btu in 2012 to 35.4 quadrillion Btu in 2034 and remains at that level through 2040. Consumption of domestically produced biofuels increases slightly through 2022 and then remains relatively flat. Production of cellulosic biofuels currently represents less than 1 percent of their legislated target and their production is expected to remain below their legislated target through the projection period.
Domestic natural gas consumption increases from 25.6 trillion cubic feet in 2012 to 31.6 trillion cubic feet in 2040. The largest share of the growth is for electricity generation, but industrial demand also increases due to competitive natural gas prices. Demand for natural gas in the electric power sector increases from 9.3 trillion cubic feet in 2012 to 11.2 trillion cubic feet in 2040 to replace the expected retirement of 50 gigawatts of coal-fired capacity by 2021 and to support a modest growth in electricity demand.
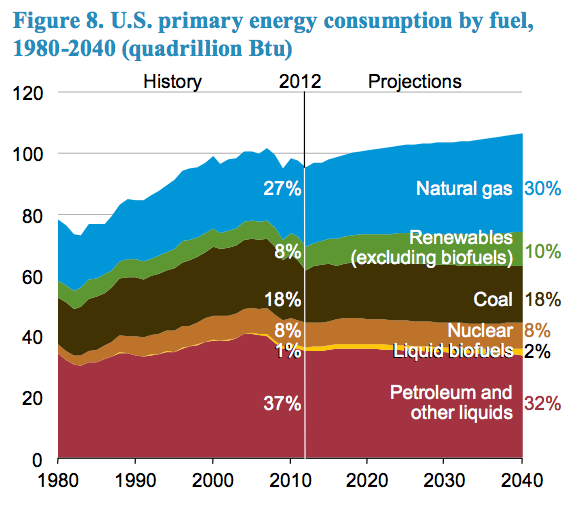
Source: Annual Energy Outlook 2014, http://www.eia.gov/forecasts/aeo/er/early_fuel.cfm
Coal consumption increases from 17.3 quadrillion Btu (891 million short tons) in 2012 to 18.7 quadrillion Btu (979 million short tons) in 2040. Coal consumption declines in 2016 because of the premature retirement of capacity due to MATS. After 2016, coal-fired electricity generation is expected to increase slowly over the next decade as the remaining coal-fired capacity is used more intensively, but few new capacity additions are expected.
Due to the federal renewable fuel standard for transportation fuels and state renewable portfolio standards for electricity generation, consumption of renewable fuels is expected to increase by 1.4 percent per year and garner almost 12 percent of the energy market in 2040, up from 9 percent in 2012.
Conclusion
As with preceding EIA forecasts and those of other agencies, fossil fuels dominate the energy production and supply picture of the United States through 2040. Although federal and state policies attempt to dampen their use and increase renewable energy, the EIA expects renewable energy and fossil fuel supply to change only slightly over the next several decades.
