
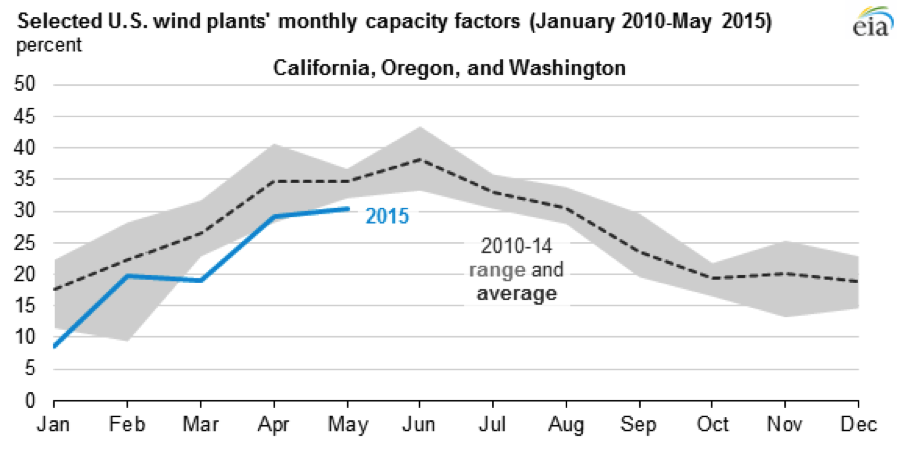
Wind capacity factors can vary greatly across regions because the output from wind turbines are dependent on the wind resources in the area. A capacity factor measures the amount of electricity actually produced by a generating unit compared to the electrical energy that could have been produced at continuous full power operation. Because the amount of electrical energy produced by a wind turbine varies nonlinearly with wind speed, small changes in wind speed can result in much larger changes in output.
For instance, capacity factors for wind units on the U.S. West Coast for the first five months of this year were consistently below their previous five-year average because wind speeds dropped in California, Oregon and Washington.[i] In January, wind speeds were approximately 20 percent to 45 percent lower than normal for portions of the West Coast, and capacity factors for wind plants in California, Oregon, and Washington were about 50 percent lower than the January average of the previous five years. This is an issue not only for owners and operators of wind farms who depend on output for revenues and income from the federal production tax credit, but also for wind farm investors that depend on output to generate bottom-line performance.[ii]
Source: EIA, http://www.eia.gov/todayinenergy/detail.cfm?id=22452
Wind on the U.S. West Coast
At the end of 2009, California, Oregon, and Washington had 6.3 gigawatts of wind capacity and by the end of 2014, they had increased that capacity by an additional 5.3 gigawatts. Wind generation in those three states increased from 12,882 gigawatt hours in 2009 to 28,614 gigawatt hours in 2014—more than double.
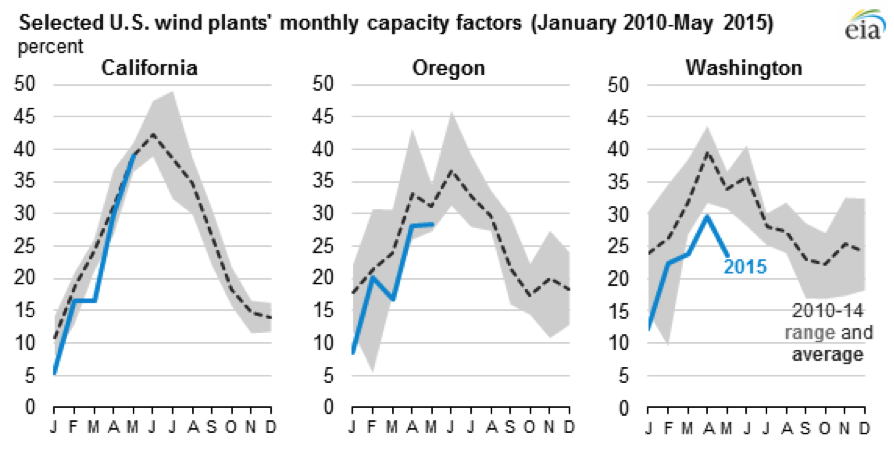
Generally, wind turbine performance on the West Coast this past spring tended to be lower the farther north the turbines are located; wind turbine performance in Washington was more than 25 percent below average levels in March, April, and May. California’s wind turbines seem to have recovered to more normal levels, probably due to its more favorable climate and geography. But, wind turbine performance in Oregon and Washington still remains below 2010 to 2014 levels.
Wind generation varies over different time periods–from sub-hourly to seasonally, reflecting variations in wind speeds. Capacity factors for wind turbines in Oregon and Washington vary much more by month than for wind turbines in California. California’s wind resources and generator output tends to peak during the summer at a time when electricity demand in the state is also relatively high. Grid operators need to be aware of wind turbine performance in their areas in order to schedule other sources of power when wind output is not available. For this reason, forecasting wind power output is important.
Source: EIA, http://www.eia.gov/todayinenergy/detail.cfm?id=22452
Wind Capacity Factors by U.S. State
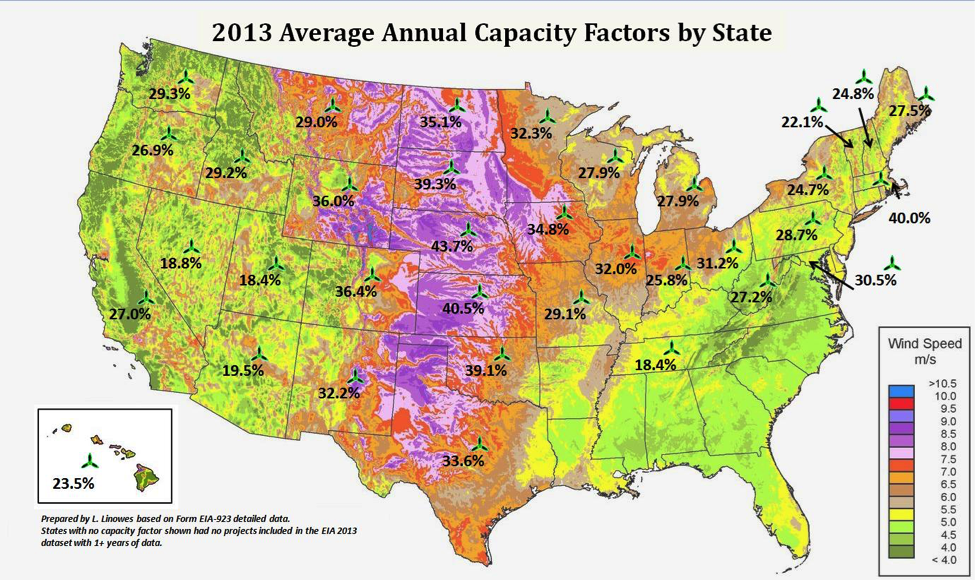
The map below provides wind capacity factors by state for 2013 that were calculated from Energy Information Administration (EIA) data. On the mainland, the capacity factors range from 18.4 percent for Tennessee to 43.7 percent for Nebraska—the latter state is in the U.S. interior where the best wind speeds are located as can be seen by the map. Note also that the southeast does not have installed wind turbines because wind speeds there are not conducive for much wind output. For this reason, those states do not have a Renewable Portfolio Standard that mandates specified amounts of renewable power. Another example of the variability of wind capacity factors is that of Hawaii, whose wind capacity factor was almost halved between 2012 and 2013.[iii]
Source: Wind Action, http://www.windaction.org/posts/37255-u-s-average-annual-capacity-factors-by-project-and-state#.VgRH-ctVikp
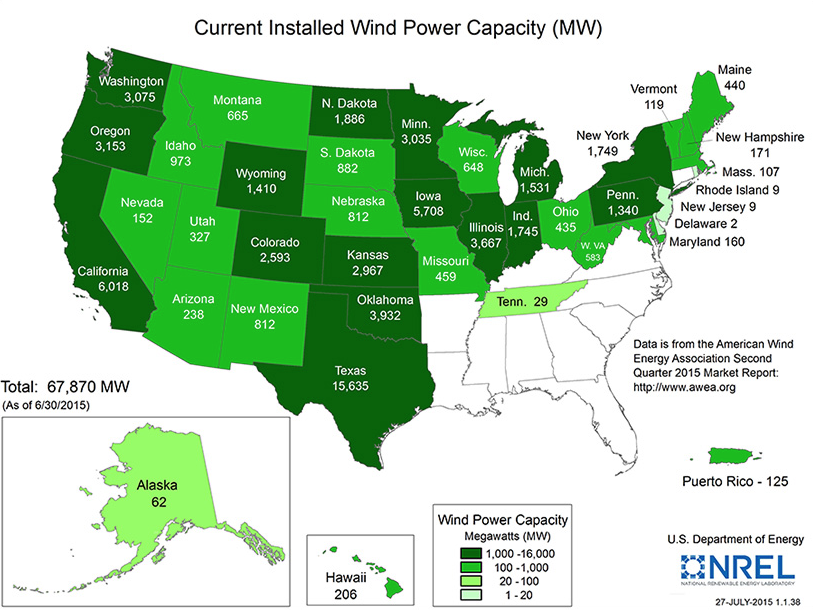
The following map provides installed wind capacity by U.S. state, taken from the Second Quarter 2015 Market Report by the American Wind Energy Association. Note that Texas has the largest wind capacity in the nation at over 15.6 gigawatts, followed by California with 6 gigawatts, and Iowa with 5.7 gigawatts.[iv] Each of these states has a Renewable Portfolio Standard that mandates generation from qualified renewable technologies by specified dates.
Source: http://apps2.eere.energy.gov/wind/windexchange/wind_installed_capacity.asp
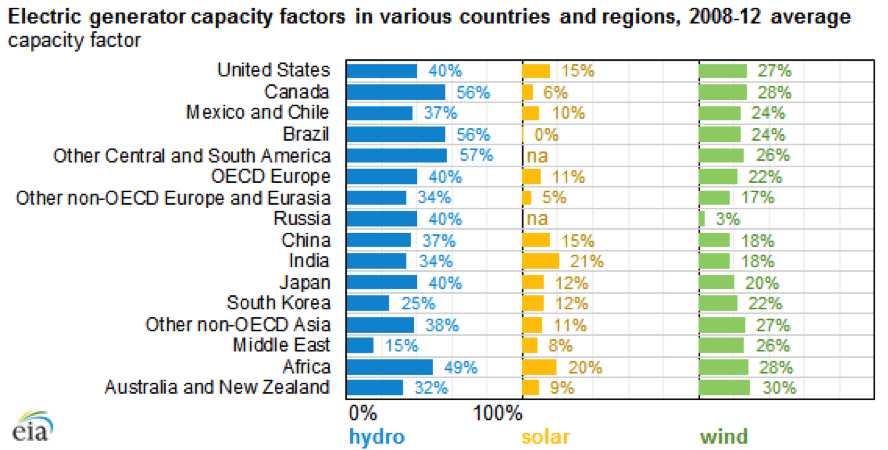
Wind Capacity Factors Worldwide
EIA provides the following chart of capacity factors for hydroelectric, wind, and solar power worldwide. Note that the agency calculates an average capacity factor for wind power in the United States of 27 percent between 2008 and 2012. The worldwide range of capacity factors for that time period is between 3 percent for Russia and 30 percent for Australia/ New Zealand.[v]
Source: EIA, http://www.eia.gov/todayinenergy/detail.cfm?id=22832
Conclusion
The output from wind turbines can be very variable and is heavily dependent on the wind speeds of the area where it is located. Wind capacity in the United States has grown steadily over the past 8 years due to state Renewable Portfolio Standards and to lucrative subsidies at the Federal and State levels. This includes the production tax credit that pays wind energy producers 2.3 cents per kilowatt hour of generation produced by a wind unit over its first ten years of operation. Thus, taxpayers pay and consumers pay for the wind generation. The cost to the taxpayer and consumer is much more than the cost of generating power from existing power plants, as a recent IER study notes.[vi] Due to the variability of wind speeds, back-up power is needed to provide generation to meet demand when the wind does not blow or slows. So, consumers are paying again to have that back-up power available when needed. Wind is not a free good, despite environmentalists wanting us to believe that it is so.
[i] Energy Information Administration, West Coast wind patterns lead to below normal wind generation capacity factors, August 11, 2015, http://www.eia.gov/todayinenergy/detail.cfm?id=22452
[ii] North American Wind Power, Extreme Anomalies Result in Generation Shortfalls at Western U.S. Wind Projects, March 31, 2015, http://www.nawindpower.com/e107_plugins/content/content.php?content.14078#utm_medium=email&utm_source=LNH+04-01-2015&utm_campaign=ORB+News+Headlines
[iii] Wind Action, U.S. average annual capacity factors by project and state, 2011-2013, June 14, 2014, http://www.windaction.org/posts/40618-u-s-annual-capacity-factors-by-project-and-state-2011-2013#.VgRPw8tVikq
[iv] Department of Energy, Installed Wind Capacity, http://apps2.eere.energy.gov/wind/windexchange/wind_installed_capacity.asp
[v] Energy Information Administration, Electric generator capacity factors vary widely across the world, September 8, 2015, http://www.eia.gov/todayinenergy/detail.cfm?id=22832
[vi] Institute for Energy Research, https://www.instituteforenergyresearch.org/wp-content/uploads/2015/06/ier_lcoe_2015.pdf
