
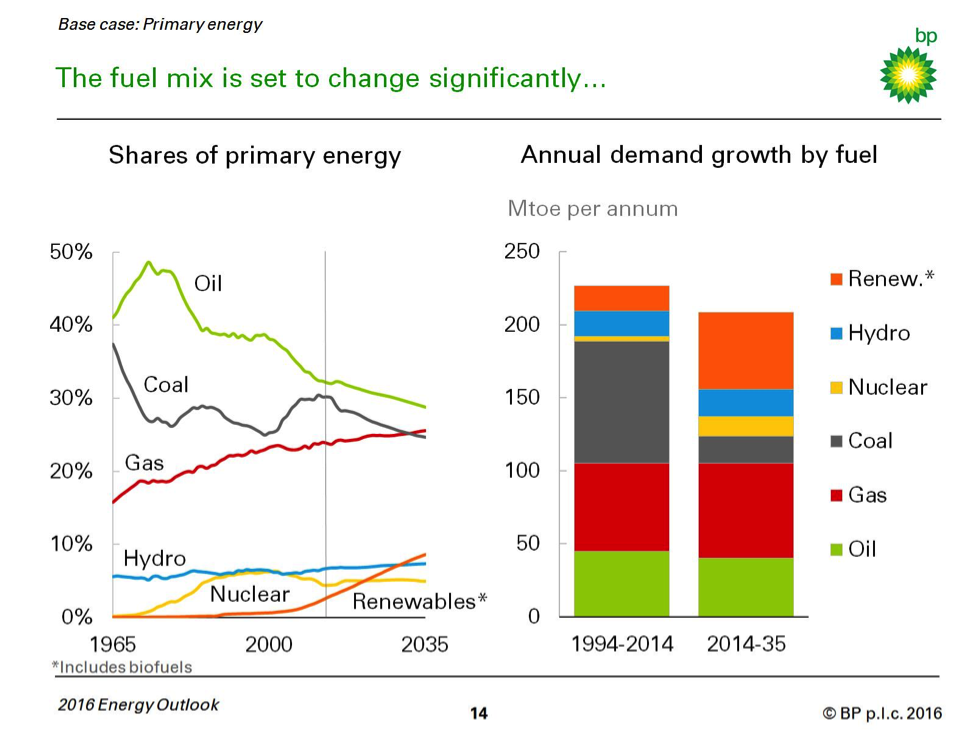
Similar to Exxon’s world outlook, BP’s energy outlook expects natural gas, oil, and coal to remain the dominant forms of global energy providing about 60 percent of the additional energy demanded and accounting for almost 80 percent of total energy supplies in 2035. The company expects energy demand to increase by 34 percent between 2014 and 2035 due to economic growth and population increases. China and India together account for almost half of the projected increase in global GDP, with the developed economies of the OECD (Organization for Economic Co-operation and Development) accounting for about a quarter. Almost all of the additional energy, however, is consumed in emerging economies with growth in China’s energy demand slowing as its economy adjusts to a more sustainable rate. BP expects the fuel mix to change significantly with coal dropping and renewable energy growing rapidly, almost quadrupling by 2035 and supplying a third of the growth in power generation. (See chart below.)
[i] Source: BP Energy Outlook, Powerpoint, http://www.bp.com/en/global/corporate/energy-economics/energy-outlook-2035/energy-outlook-downloads.html
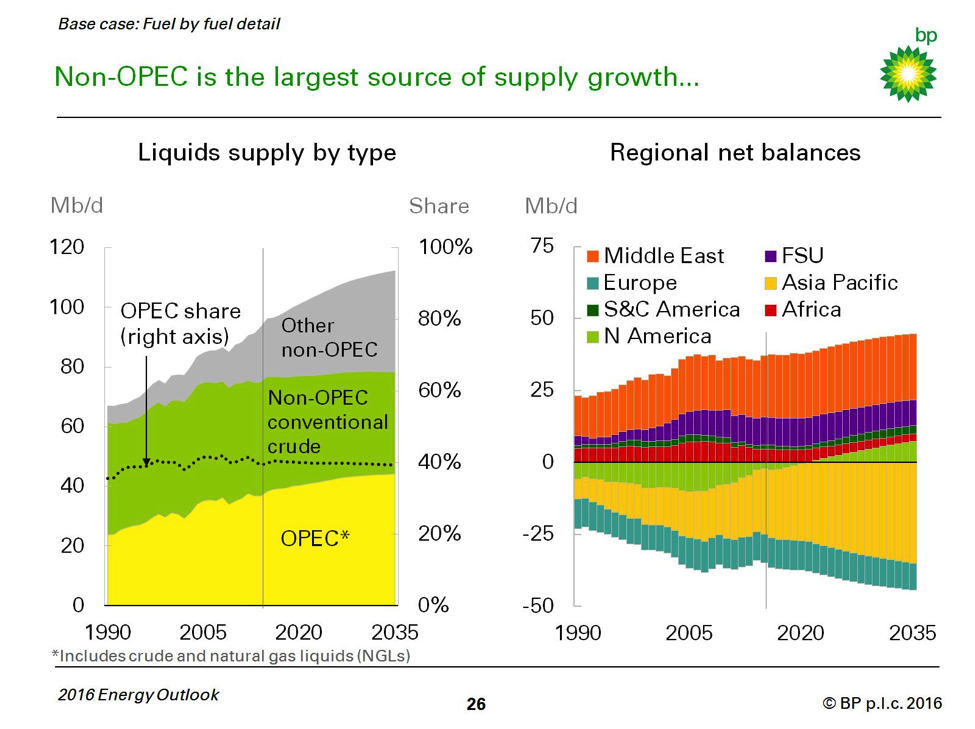
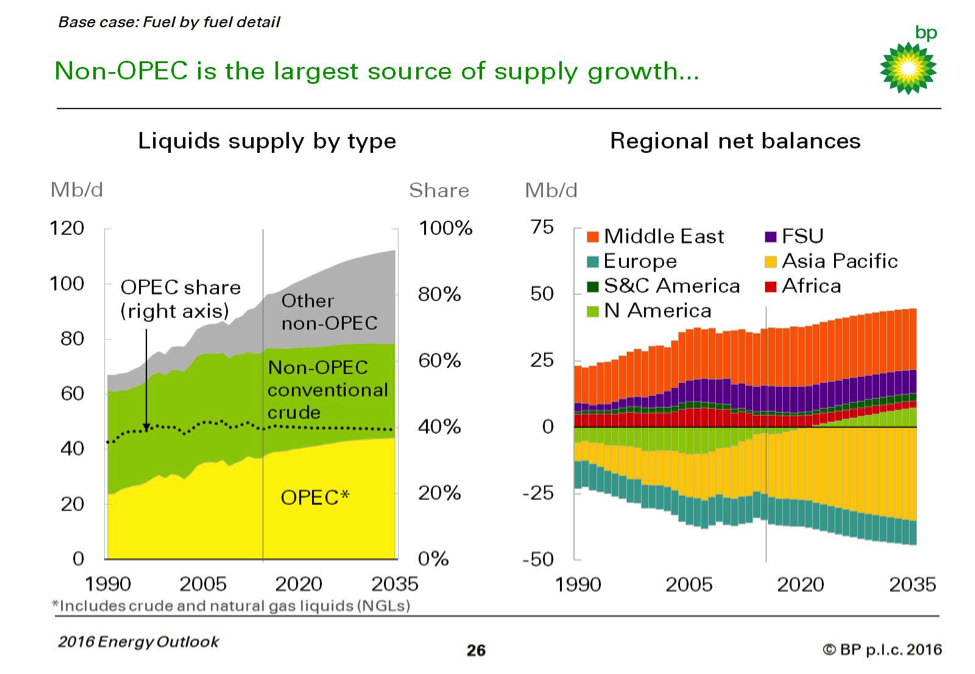
BP sees the oil market rebalancing gradually with the current low level of prices increasing demand and dampening supply. BP expects the global vehicle fleet to more than double, increasing the demand for liquid fuels. To help supply that demand, BP sees growth in both OPEC and non-OPEC oil supply with non-OPEC growth exceeding OPEC growth. (See chart below.) Non-OPEC oil supply is met mostly by U.S. shale oil, Brazilian deep water, and Canadian oil sands. BP expects U.S. shale oil production to double over the next 20 years.
Source: BP Energy Outlook, Powerpoint, http://www.bp.com/en/global/corporate/energy-economics/energy-outlook-2035/energy-outlook-downloads.html
China
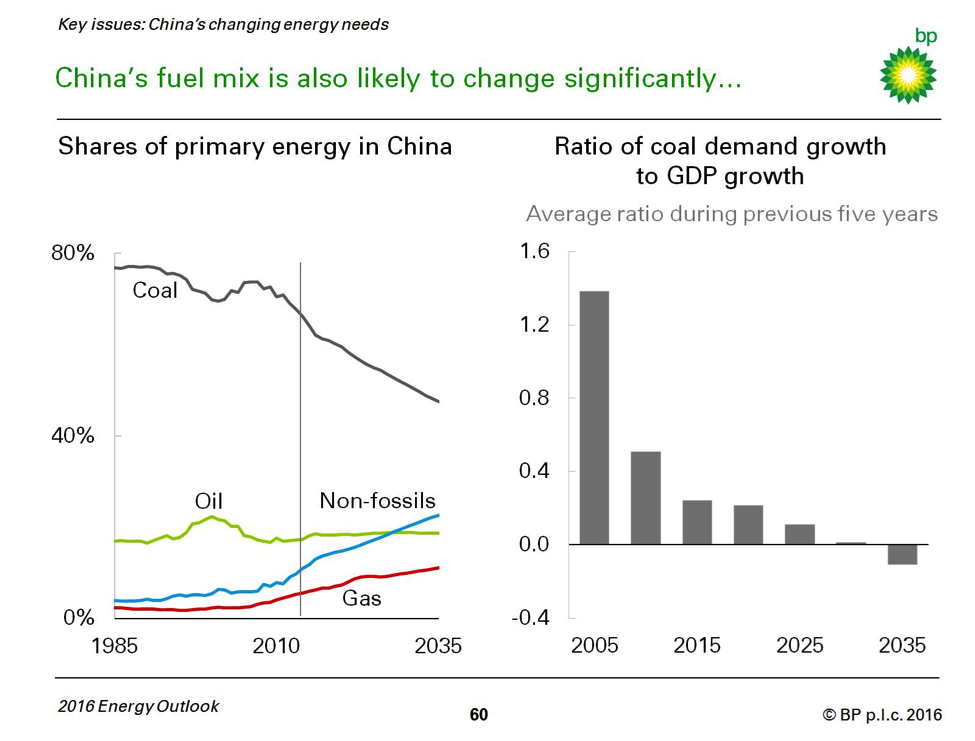
China’s demand for energy is expected to grow much slower over the next 20 years than in the past. Future energy demand growth is expected to grow at 2 percent per year over the forecast period compared to 8 percent annual growth since 2000. China’s economy is expected to grow at 5 percent a year between 2014 and 2035, about half the rate since 2000. China’s energy demand grows more slowly than its economic growth because of efficiency improvements and the diversification of its economy from energy intensive industries to the service sector that demands less energy. BP expects China’s fuel mix to change significantly due to its changing economic structure and to environmental and climate policies. China’s coal consumption grows by only 0.2 percent a year in BP’s outlook, dropping coal’s share of China’s energy mix from two-thirds today to less than 50 percent by 2035. This occurs because of slower energy demand growth, China’s economy becoming less dependent on coal-intensive sectors, and polices encouraging the use of alternate fuels. Non-fossil fuels and natural gas increase their share in China’s energy mix from 15 percent today to about a third by 2035.
Source: BP Energy Outlook, Powerpoint, http://www.bp.com/en/global/corporate/energy-economics/energy-outlook-2035/energy-outlook-downloads.html
Petroleum Demand and Supply
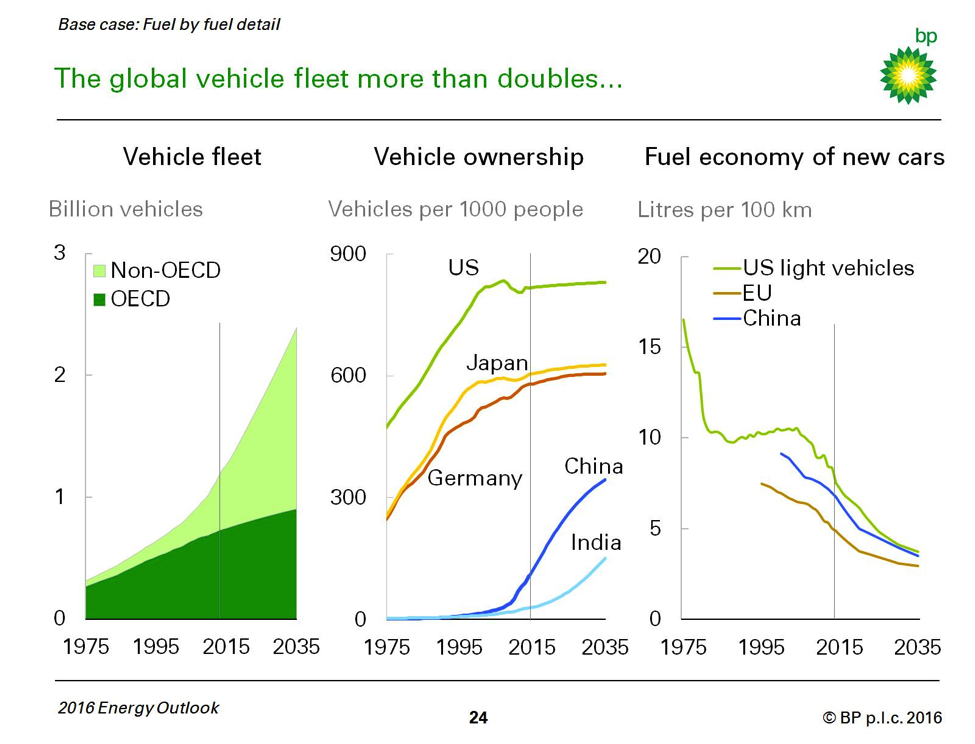
The growth in the demand for liquid fuels is expected to come primarily from the transportation sector, accounting for two-thirds of the increase, followed by the industrial sector with growth in petrochemicals. Transport fuel is dominated by petroleum (88 percent in 2035). The share of non-petroleum fuels in transport increases from a 7 percent share in 2014 to 12 percent in 2035, with natural gas growing the fastest at 6.3 percent per year. The global vehicle fleet (commercial vehicles and passenger cars) more than doubles from about 1.2 billion vehicles today to 2.4 billion by 2035. Almost all the growth is in emerging economies with vehicles in non-OECD countries surpassing those in OECD economies in the early 2020s. BP sees vehicle markets in the United States and Japan at near saturation. Tempering demand growth from transport vehicles is increased fuel efficiency increasing 2 to 3 percent per year compared to 1.5 percent over the past decade. Today, the average passenger car gets 30 miles per gallon, but by 2035, BP expects them to reach 50 miles per gallon.
Source: BP Energy Outlook, Powerpoint, http://www.bp.com/en/global/corporate/energy-economics/energy-outlook-2035/energy-outlook-downloads.html
BP expects global liquid fuel supply to increase by 19 million barrels per day by 2035. BP expects OPEC to maintain their market share of 40 percent by increasing supply by 7 million barrels per day, reaching 44 million barrels per day of production. U.S. shale oil (crude and natural gas liquids), other tight oil production, Brazilian deep water, Canadian oil sands, and biofuels combined increase by 16 million barrels per day, offsetting areas with supply reductions. North America’s dependence on oil imports lessens due to the increase in shale oil production and declining demand, becoming self-sufficient over the next few years, aided by the lifting of the oil import ban. Asia’s dependence on oil imports grows, accounting for almost all the growth in oil exports in the forecast.Tight oil (shale oil) production is expected to increase by 5.7 million barrels per day to 10 million barrels per day in 2035 and remain primarily concentrated in the United States. U.S. shale oil production is expected to increase from around 4 million barrels per day today to 8 million barrels per day in the 2030s, accounting for almost 40 percent of U.S. production.[ii]
Source: BP Energy Outlook, Powerpoint, http://www.bp.com/en/global/corporate/energy-economics/energy-outlook-2035/energy-outlook-downloads.html
Natural Gas
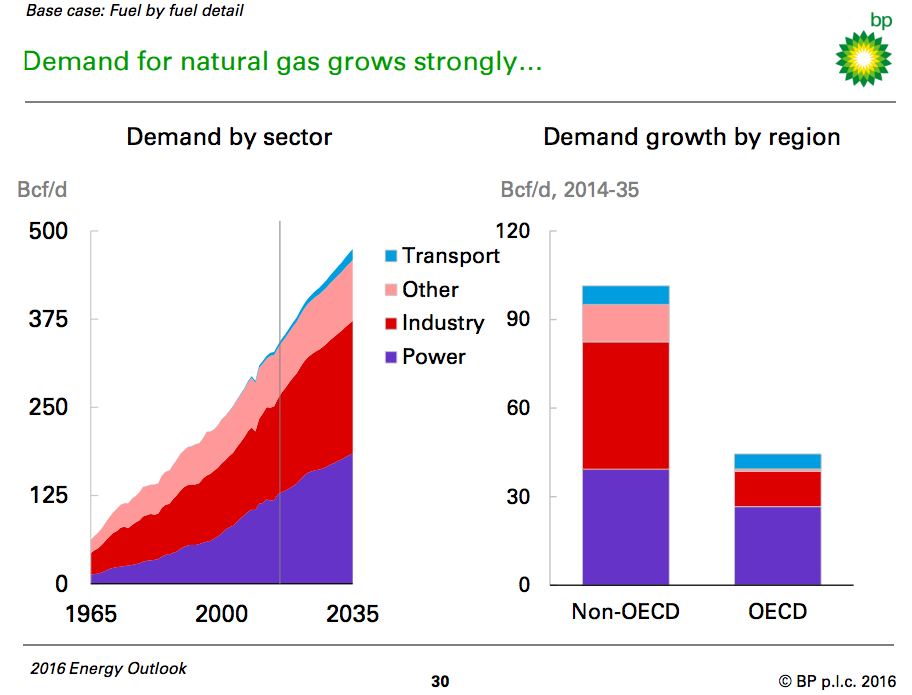
Natural gas is the fastest growing fossil fuel, growing by 1.8 percent per year due to ample supplies and supportive policies. The majority of the increase comes from emerging economies with China and India representing about 30 percent of the increase and the Middle East over 20 percent. In the emerging economies, natural gas is split between industrial and power generation use. In the OECD, natural gas growth is primarily used for power generation. (See chart below.) On the production side, the supply increase is fairly evenly split between conventional production and shale gas. Most of the increase in conventional production comes from the non-OECD, primarily the Middle East, China, and Russia. Shale gas grows at 5.6 percent a year, increasing its share of production from slightly over 10 percent today to almost a quarter in 2035. In the first half of the outlook, almost all the growth in shale gas comes from the United States. Later, China’s shale gas production increases such that by 2035, China is the largest contributor of shale gas growth. BP sees LNG increasing its share of world demand from 10 percent today to 15 percent in 2035.
Source: BP Energy Outlook, Powerpoint, http://www.bp.com/en/global/corporate/energy-economics/energy-outlook-2035/energy-outlook-downloads.html
Coal
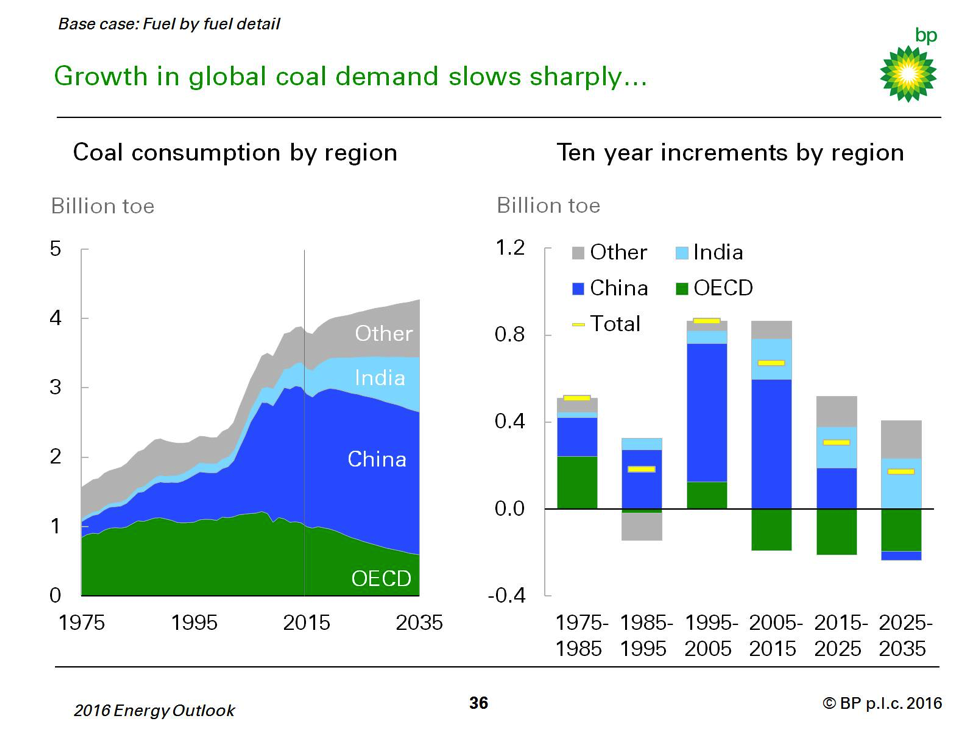
BP expects coal demand to slow greatly from a 3 percent annual growth rate over the past 20 years to 0.5 percent over the next 20 years principally caused by a change in fuel mix in China. China, however, remains the largest coal user, consuming almost half of global coal supply in 2035. India has the largest growth in coal consumption, surpassing the United States as the second largest consumer of coal. Most (over two-thirds) of India’s growth in coal consumption is for power generation. Coal demand in both the United States and OECD Europe is expected to drop by over 50 percent due to abundant natural gas supplies, stronger environmental regulation, and declining prices assumed for renewable energy.
Source: BP Energy Outlook, Powerpoint, http://www.bp.com/en/global/corporate/energy-economics/energy-outlook-2035/energy-outlook-downloads.html
Hydroelectric and Nuclear Power
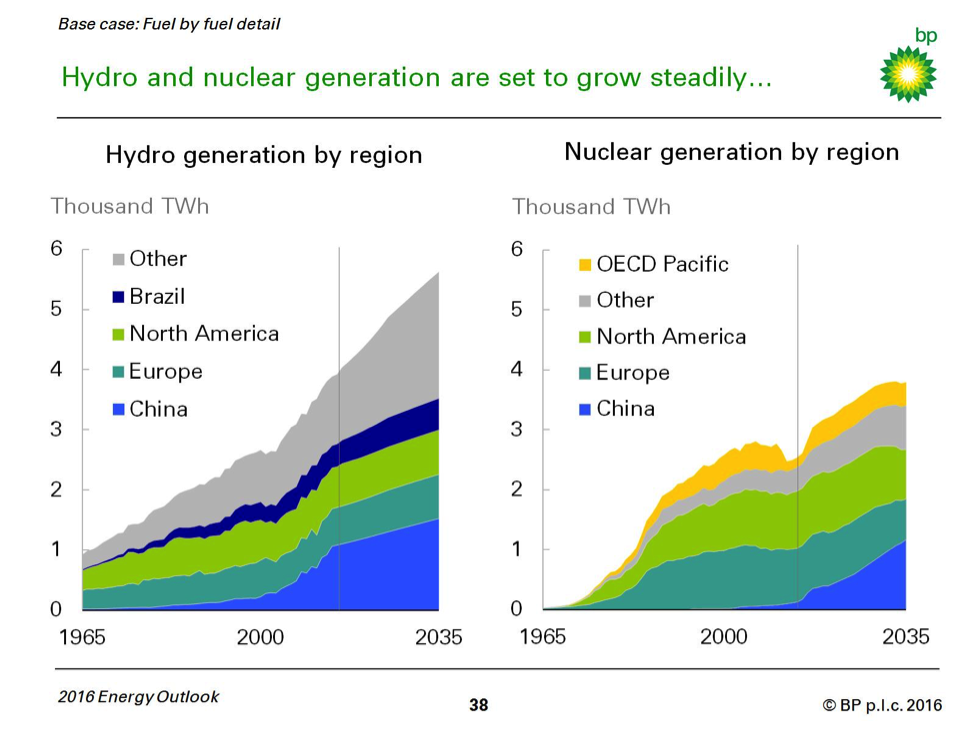
Hydroelectric energy is expected to grow by 1.8 percent per year and nuclear power by 1.9 percent. While hydroelectric power in China grew at 10 percent per year over the past 20 years, it is expected to grow only 1.7 percent per year in BP’s forecast. But, China still remains the largest hydropower economy. Brazil, however, over takes Canada as the second largest hydropower producer in the forecast period. BP expects China to increase its nuclear power by 11.2 percent per year, more than doubling by 2020 and increasing 9-fold by 2035. Japan restarts its nuclear reactors over the next 5 years, reaching 60 percent of their 2010 levels by 2020. Nuclear power production declines by 29 percent in Europe and 13 percent in North America, as ageing plants are decommissioned and new investments in nuclear power are stunted by economic and political challenges.
Source: BP Energy Outlook, Powerpoint, http://www.bp.com/en/global/corporate/energy-economics/energy-outlook-2035/energy-outlook-downloads.html
Non-Hydro Renewable Energy
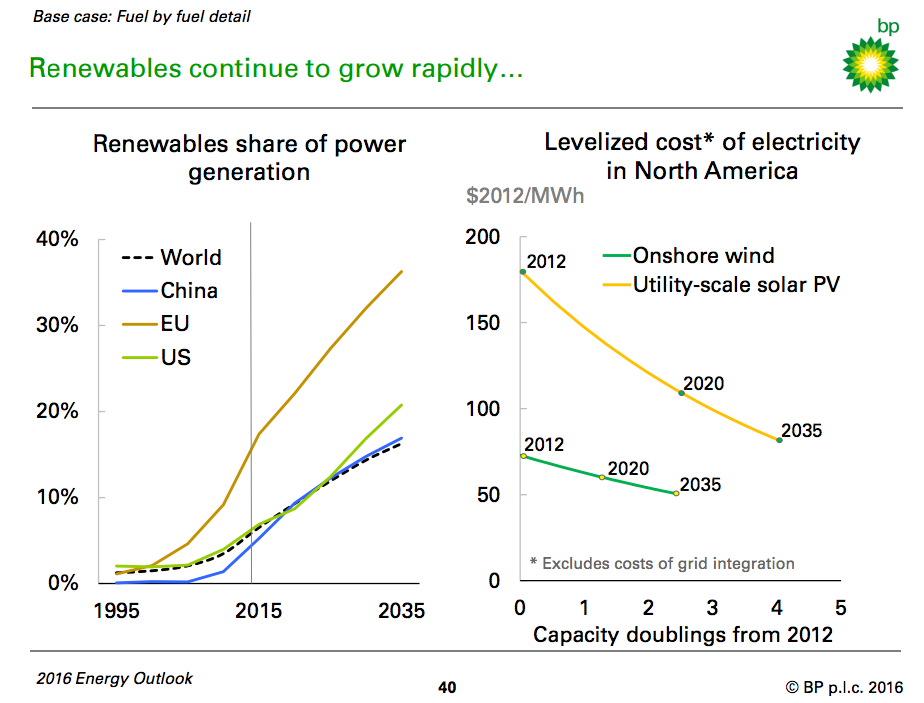
Non-hydro renewable energy is expected to grow by 6.6 percent per year in BP’s forecast, becoming the fastest growing fuel area. Non-hydro renewable energy accounts for over a third of the increase in power generation, increasing its share to 16 percent by 2035. The rapid growth is due to assumed cost declines over the next 20 years—25 percent decline for onshore wind and 40 percent for utility scale solar PV. Europe remains the largest consumer of non-hydro renewable power, but the United States surpasses it in volume growth and China adds more than Europe and the United States combined. By 2035, renewable energy supplies over one-third of Europe’s power generation. In some markets, the renewable energy share challenges electric grid operation due to the intermittency of wind and solar energy.
Source: BP Energy Outlook, Powerpoint, http://www.bp.com/en/global/corporate/energy-economics/energy-outlook-2035/energy-outlook-downloads.html
Conclusion
BP’s energy outlook for 2016 projects less energy demand compared to its 2015 outlook. Compared to last year’s outlook, BP projects global demand in 2035 down almost 1 percent, coal demand in 2035 down by 6 percent, natural gas demand down by almost 3 percent, and non-hydro renewable energy up by 14 percent. The company still sees fossil fuels dominating the energy outlook with almost an 80 percent share in 2035 and contributing 60 percent of demand growth.
[i] BP Energy Outlook 2016, February 2016, http://www.bp.com/en/global/corporate/energy-economics/energy-outlook-2035/energy-outlook-downloads.html
[ii] CNBC, Here’s the upside for oil producers, February 10, 2016, http://www.cnbc.com/2016/02/10/bp-heres-the-upside-for-oil-producers.html
