
From the June 2019 BP Statistical Review of Global Energy, the following are some details on global C02 emissions between 2005 and 2018 (the most recent year available):
- Between 2005 and 2018, global CO2 emissions from energy grew by 20 percent (5748 million metric tons)
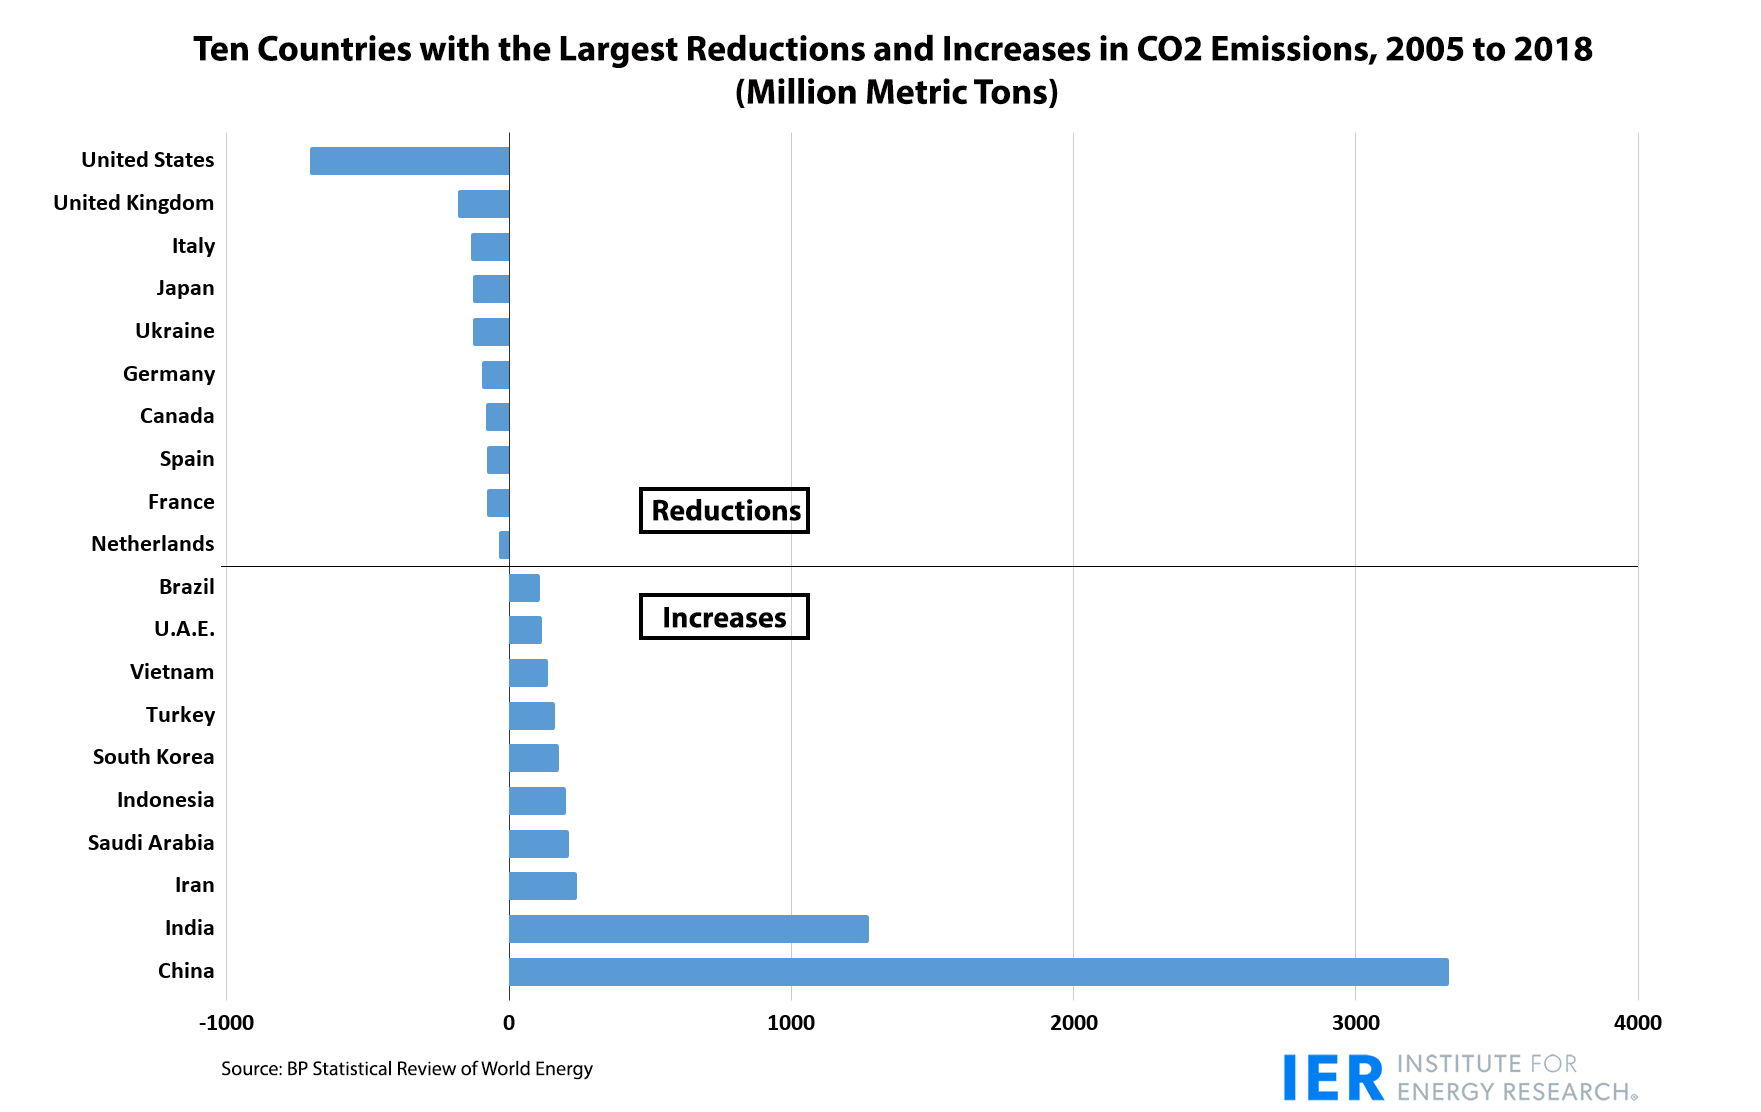
- Declines in CO2 emissions between 2005 and 2018 were led by the United States (-12 percent and 706 million metric tons). Annual CO2 emissions in the United States declined 8 times during this period.
- The next largest decline was in the United Kingdom (-32 percent and 182 million metric tons).
- The largest increase in carbon dioxide emissions between 2005 and 2018 came from China (55 percent and 3329 million metric tons).
- The next highest increment came from India where emissions rose by 106 percent (1275 million metric tons).
- Together, China and India accounted for 80 percent (4604 million metric tons) of the increase in global carbon emissions (5748 million metric tons).
