
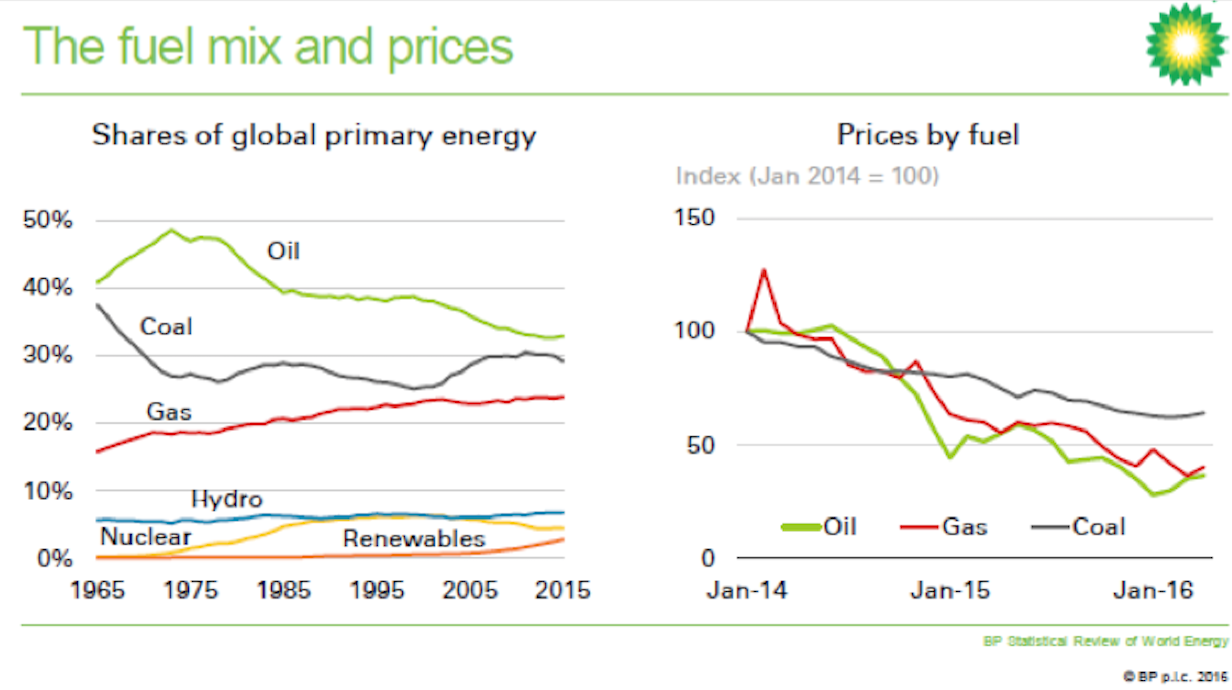
According to the BP Statistical Review 2016, global coal consumption fell in 2015 by 1.8 percent—the largest decline since the mid-1960s when BP first reported data. In 2015, oil was the largest source of energy and coal was the second largest. Coal’s 29.2 percent of global energy consumption was the lowest global share since 2005.[i] In the United States, draconian regulation plus low natural gas prices made natural gas competitive with coal in electricity markets.
Some major economies, including the United States and China, decreased their coal consumption in 2015 while a number of other countries including India, Indonesia, Japan, Australia, Poland, and Spain all increased their coal consumption.
Oil’s share of the market, on the other hand, rose to a 16-year high as its price fell. In 2015, oil increased its market share to about a third of total world energy consumption. Last year, oil demand increased at almost double the pace of 2014. Low crude oil prices over the past two years made gasoline and diesel more affordable, spurring consumers to drive more. Oil consumption in the United States increased by 1.6 percent and in the European Union by 1.5 percent. China increased its oil consumption by 6.3 percent and India increased its oil consumption by 8.1 percent, surpassing Japan, whose oil consumption fell 3.9 percent in 2015, to become the world’s third-largest oil consumer.
Coal
Coal is inexpensive, reliable, and abundant, and energy from coal is lifting millions out of poverty in China, India and other emerging nations. It is also more accessible than other energy sources, easier to transport and simpler to store. Eastern Europeans see their domestic supplies of coal as an alternative to Russian oil and gas.
Coal ranks second to oil among the world’s energy sources and its global reserves will last for 113 years at 2015 production levels. China consumes over 4 times the amount of coal that the United States consumes–the most of any nation in the world. China, Japan and India are the largest coal importers while Indonesia, Australia, Russia and the United States are the largest exporters of coal.
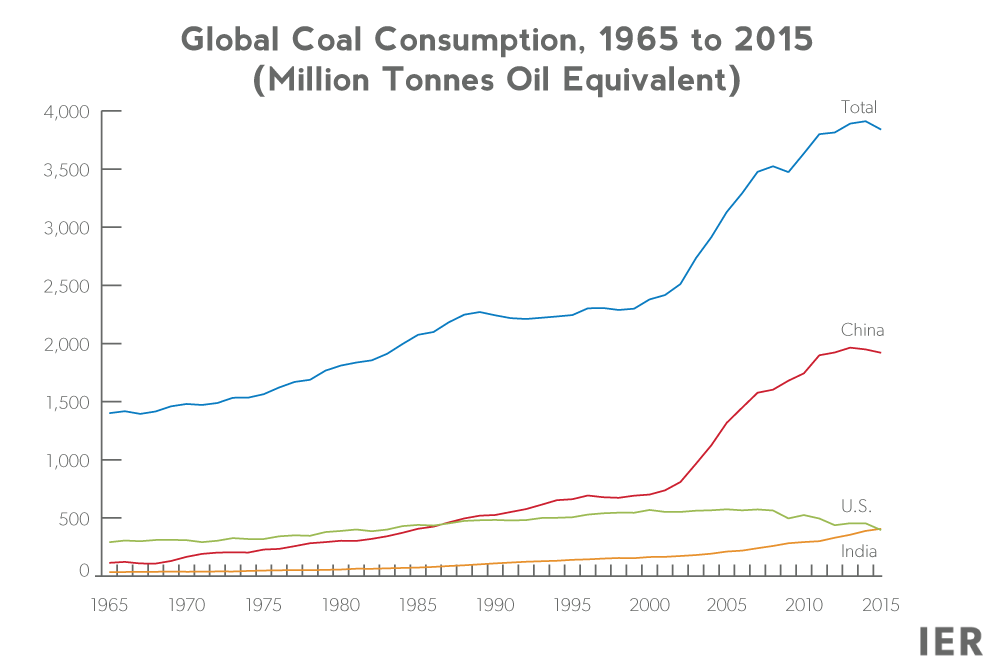
Source: BP Statistical Review, http://www.bp.com/en/global/corporate/energy-economics/statistical-review-of-world-energy.html
In 2015, coal consumption declined in the United States by 12.7 percent and in China by 1.5 percent as these countries retired coal-fired power plants and used natural gas, nuclear power and renewable energy in their stead. In other countries, such as India and Indonesia, coal demand increased to bring more electrification to their population. Last year, coal consumption increased 4.8 percent in India and 15 percent in Indonesia. Also, in 2015, India surpassed the United States as the world’s second largest consumer of coal. The United States is now only the third largest coal consumer in the world, despite having – by far — the world’s largest coal resources.
In 2015, Germany’s coal consumption fell slight (by 0.6 percent) but since 2009, Germany’s coal consumption has increased by 9.2 percent.[ii] The reason is that Germany is using coal to back-up its wind and solar plants that are replacing the country’s retiring nuclear power plants. When the tsunami hit Japan’s nuclear power plants at Fukushima in 2011, Germany made a decision to replace its nuclear units with non-hydroelectric renewable energy. But because intermittent renewables need to be backed up when the wind is not blowing and the sun is not shining, Germany is turning to coal, which is less expensive than natural gas in Europe. Germany started two new coal-fired plants in 2015.
The following chart shows the percent change for all of the countries that consumed more than 1 percent of the world’s coal in 2015. (South and Central America was included for additional context as it consumed 1 percent of the world’s coal as a region). While overall coal consumption was down slightly in 2015, it is not obvious that the trend will continue.
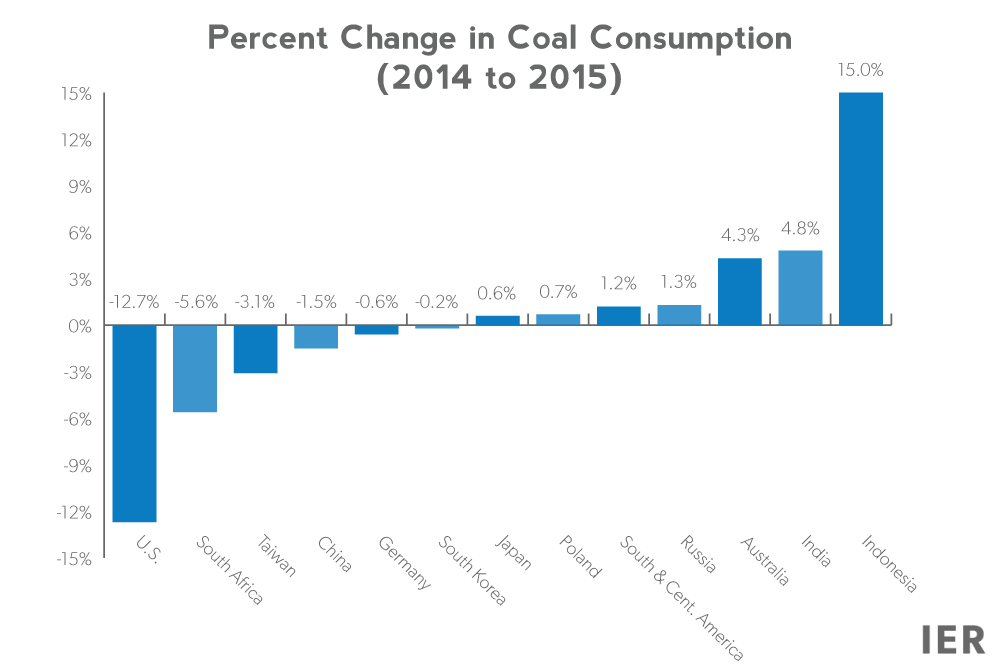
Source: BP Statistical Review 2016, http://www.bp.com/en/global/corporate/energy-economics/statistical-review-of-world-energy.html
Oil
Crude oil prices began to drop in mid-2014 as increasing oil production from the United States, Russia and the Organization of Petroleum Exporting Countries resulted in a surplus that eventually pushed prices below $30 a barrel. While oil prices are around 80 percent higher today, they are still half their level of two years ago. Global petroleum inventories remain high and in the United States, these inventories are near an 80-year high.
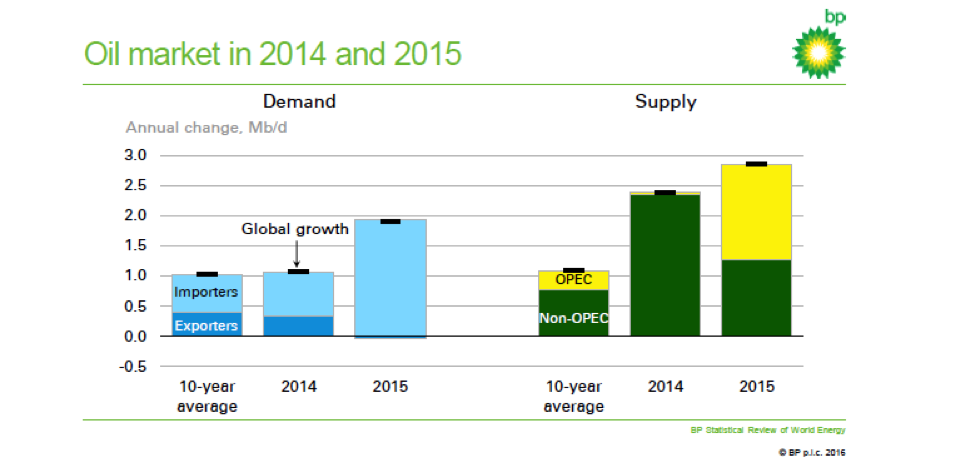
Last year, global oil demand increased by 1.9 million barrels per day—almost twice its 10 year average of 1.0 million barrels per day. Net oil importers increased their demand with China’s demand up 0.8 million barrels per day, India’s and the U.S. demand each up by 0.3 million barrels per day, and the European Union’s demand up 0.2 million barrels per day.
On the supply side, non-OPEC production increased by 1.3 million barrels per day. Brazil, Russia, the UK, and Canada all increased production. U.S. oil rigs peaked in October 2014 at just over 1600, but fell by about two-thirds by the end of last year, resulting in less U.S. oil production growth in 2015 than in 2014 when it grew by 1.7 million barrels per day. U.S. oil production increased by 1.0 million barrels per day in 2015 and reinforced the U.S. position as the world’s largest oil supplier. (BP includes natural gas plant liquids in its oil production total.)
Investment in oil and natural gas projects is estimated to have declined by about $160 billion in 2015–about a quarter less than its 2014 level–the largest proportionate decline since the late 1970s, which will detract from future supply growth.
OPEC oil production increased substantially by 1.6 million barrels per day to a new record of 38.2 million barrels per day with Iraq increasing production by 0.7 million barrels per day and Saudi Arabia increasing production by 0.5 million barrels per day. Iran and the United Arab Emirates each increased production by 0.2 million barrels per day. The increase in total global oil production of 2.8 million barrels per day outstripped demand growth of 1.9 million barrels per day, adding to the supply imbalance.
Natural Gas
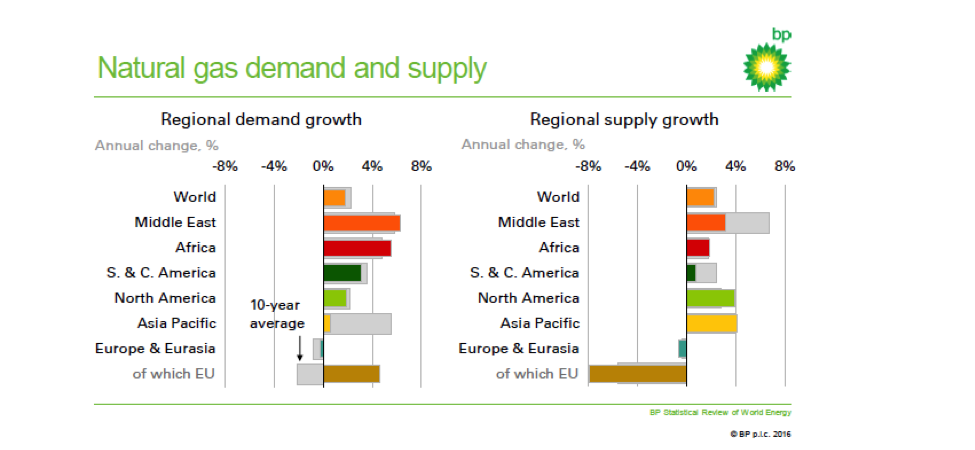
In 2015, growth in global natural gas production was strong, but demand outside of the power sector was subdued, leading global prices to fall. For example, the Henry Hub price fell 40 percent relative to its 2014 average; the Japan Korea Marker price fell 46 percent. Natural gas consumption increased by 1.7 percent in 2015, more than in 2014 (0.5 percent) but less than its historical average of around 2 percent.
On the demand side, Asian growth slowed to 0.5 percent with China’s demand growing 4.7 percent, falling from double-digit growth seen over much of the past 10 years. In the European Union, natural gas demand grew 4.6 percent and in the Middle East, it grew by 6.2 percent.
On the supply side, natural gas production in the United States increased by 5.4 percent in 2015, accounting for over half of the increase in world production. All of the increase in gas production in the United States was due to shale gas; conventional gas production in the United States fell. Natural gas production also increased in the Middle East (3.1 percent), Norway (7.7 percent), China (4.8 percent) and Australia (9.4 percent).
Non-Fossil Fuels
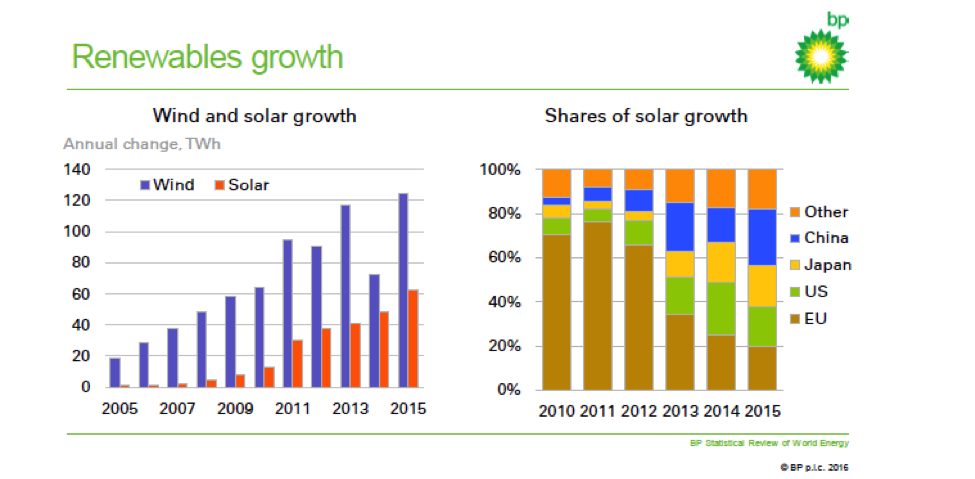
Non-fossil fuels increased by 3.6 percent in 2015—up slightly from their 10-year average. Non-hydroelectric renewable energy in the power sector increased by 15.2 percent (213 terawatt hours). Despite its share remaining small (2.8 percent), it accounted for all of the increase in global power generation in 2015 and 38 percent of the increase in global energy consumption. Wind power increased by 17.4 percent (125 terawatt hours) and solar power increased by 32.6 percent (62 terawatt hours), with China overtaking Germany and the United States as the largest generator of solar power.
Global hydroelectric power increased by 1.0 percent (38 terawatt hours), due to drought conditions in parts of the Americas and Central Europe. Nuclear energy increased by 1.3 percent (34 terawatt hours), as rapid expansion in China offset declines in mainland Europe. Nuclear power grew by 29 percent in China in 2015.
Carbon Dioxide Emissions
The slower growth in energy demand and the shift away from coal towards lower carbon fuels resulted in carbon dioxide emissions from energy use remaining fairly flat in 2015 (0.1 percent increase from 2014 levels) – the slowest growth in nearly a quarter of a century (other than in the immediate aftermath of the financial crisis). (The growth in carbon emissions over the past 10 years averaged a little over 1.5 percent a year.) The majority of the change in carbon dioxide emissions is attributable to China, whose carbon dioxide emissions are estimated to have declined slightly in 2015 (by -0.1 percent) for the first time in almost 20 years.
Conclusion
Oil remained the largest fuel consumed in 2015, followed by coal. The United States and China both used less coal in 2015 than in 2014 due to competition from natural gas, nuclear power, and renewable fuels. Despite the regulatory headwinds, coal consumption actually increased in many countries including India, Poland, Spain, and Indonesia in 2015.
Oil and natural gas prices collapsed resulting in greater global consumption of both of these fuels, each increasing by almost 2 percent. Oil supply in 2015 exceeded consumption resulting in the continuation of the imbalance begun the previous year and high levels of global petroleum stocks.
[i] Bloomberg, World Starts to Turn From Coal as Cheap Oil Gains Market, June 8, 2016, http://www.bloomberg.com/news/articles/2016-06-08/world-starts-to-turn-from-coal-as-cheap-oil-gains-market-share
[ii] BP Statistical Review 2016, http://www.bp.com/en/global/corporate/energy-economics/statistical-review-of-world-energy.html
