
Most modelers calibrate their base cases to the Energy Information Administration (EIA)’s most recent Annual Energy Outlook (AEO) when conducting analyses of energy issues. In fact, since EIA is the premier energy information source for the federal government, it would make sense that agencies turn to their expertise and numbers when calculating those measures which might involve energy. However, the EPA stands out because its regulatory agenda has enormous impacts on energy cost and availability, but it frequently chooses not to use EIA’s numbers.
For instance, the EIA’s Annual Energy Outlook 2015 reports 263 gigawatts of coal-fired capacity in its base case in 2020.[i] However, EPA just 4 months later, reports a base case where the United States will have just 208 gigawatts of coal-fired generating capacity in 2020.[ii] Starting with 55 less gigawatts of coal-fired generating capacity makes it appear much easier to comply with EPA’s regulation of carbon dioxide from power plants—what EPA calls its “Clean Power Plan.” EPA’s modeling makes it appear that fewer coal-fired retirements will be caused by its regulation and less new capacity must be built to replace the shuttered coal-fired generating units.
Creating its own energy modeling separate from that of EIA results in EPA regulations that appear more economically feasible than they otherwise would. But it is ironic that EPA complains about a lack of funding while simultaneously spending EPA resources to duplicate the modeling EIA does.
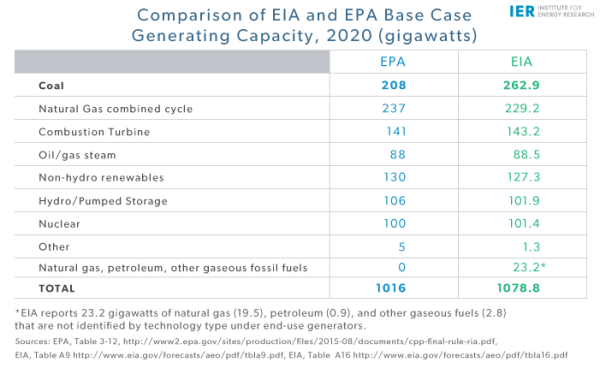
Comparison of Generating Capacity in EIA and EPA Base Cases
The table below compares the electricity generating capacity in the base cases for EPA and EIA by technology type for 2020. EPA reports 63 gigawatts less total capacity in 2020 than does EIA. Most of the capacity difference is in coal-fired generating capacity where EPA reports that only 208 gigawatts of coal capacity will be available in 2020 while EIA reports a total of 263 gigawatts—a difference of 55 gigawatts. Apparently, EPA assumes that these 55 gigawatts of generating capacity were shuttered due to other regulations that it has promulgated because as utility owners see new regulations that makes a previous regulation uneconomic, it will shutter the plant rather than modify it.
The loss of 55 gigawatts of coal-fired generating capacity from the electric fleet in EPA’s analysis means that it appears there will be less coal-fired capacity that will need to be shuttered due to the so-called “Clean Power Plan” making it less expensive in EPA’s analysis to comply with the rule. For perspective, 55 gigawatts is more capacity than the total installed coal capacity of any country expect China, the United States, and India.[iii] To further put it in perspective, Germany has about 51 gigawatts of total generating capacity meaning that EPA’s modeling assumes that enough capacity to power one of the largest economies in the world disappears by 2020.
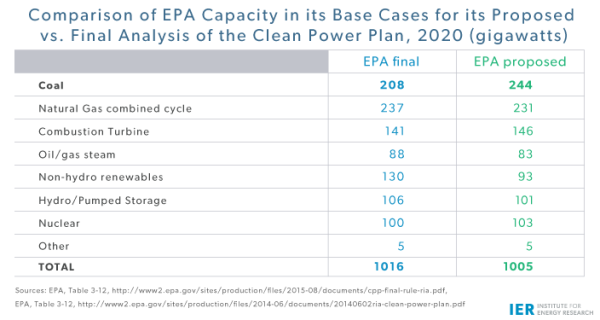
EPA Base Cases Differ Between Proposed and Final Analysis of Clean Power Plan
In June 2014, EPA published its analysis of the proposed Clean Power Plan.[iv] In that analysis, the agency reported a total of 1,005 gigawatts of generating capacity in the United States in 2020 in its base case, but changed that projection to 1,016 gigawatts in its August 2015 analysis. But the striking change was in coal-fired generating capacity where 36 gigawatts was assumed to be shuttered, being replaced by mostly renewable capacity—5 gigawatts of hydroelectric and 37 gigawatts of non-hydroelectric renewables. While the 244 gigawatts of coal-fired capacity in 2020 in EPA’s base case of its analysis of the proposed rule is still 19 gigawatts less than in EIA’s AEO 2015 base case, it was a lot closer than the 208 gigawatts of coal-fired capacity in its base case of the final rule.
EPA Analytical Results Are Radically Different from Other Analyses
In EPA’s analysis of the Clean Power Plan, the agency claims that average U.S. electricity prices in 2030 would be just 0.8 percent or 0.01 percent higher than in its reference case, depending on the case considered. Out of the 22 regions the agency models, 6 or 7 regions, depending on the case, were expected to have decreased electricity prices in 2030 compared to its base case, while 15 or 16 regions, depending on the case, were expected to have increased prices. No region was expected to see a price increase of more than 6.3 percent. One region could see a price decrease of as much as 10.1 percent. Clearly the few regions with decreased prices overwhelmed those with increased prices to make the national average increase so small.[v]
According to a study by NERA Economic Consulting, EPA’s so-called “Clean Power Plan” will hike electricity prices in all 47 states that are subject to the regulation. Of those 47 states, 40 states would see average electricity prices rise by 10 percent or more and 27 states would see average electricity prices increase 20 percent or more.[vi] Further, losses to consumers would range between $64 billion and $79 billion on a present value basis between 2022 and 2033. Energy sector expenditure increases would average between $29 and $39 billion per year. Energy expenditures in this analysis include changes in electricity generation costs, energy efficiency costs, and natural gas costs to non-electric consumers, but does not include increased costs for transmission and distribution and natural gas infrastructure.
Energy Ventures Analysis’ study of the EPA’s “Clean Power Plan” finds: 1) consumers will pay an additional $214 billion by 2030; 2) 45 states will see double digit increases in wholesale electricity costs; 3) 16 states will see a 25 percent or higher increase in wholesale electricity costs; and 4) 41,000 megawatts of perfectly good electric generating capacity will be forced to prematurely retire, costing the nation $64 billion to needlessly replace.[vii]
Conclusion
It is not surprising that EPA’s analysis of its regulation of carbon dioxide from power plants would differ from other analyses that calibrate to EIA’s report because EPA makes the heroic assumption that enough generating capacity to power Germany disappears without this regulation.
When EPA promulgates rule after rule against the electric generating sector, it is not unexpected that electric generating owners will shutter a plant early rather than make modifications to comply with ever increasing amounts of red tape. What is disingenuous, however, is that EPA magically changes its base case coal-fired generating numbers to make compliance less expensive as it did between its analysis of its proposed vs. final rule. While other modelers calibrate to EIA’s base case, EPA clearly does not. So, it looks like the agency is “fudging the numbers” in order to get a desired result.
[i] Energy information Administration, Annual Energy Outlook 2015, Table A9, Electric Generating Capacity, April 14, 2015, http://www.eia.gov/forecasts/aeo/pdf/tbla9.pdf
[ii] Environmental Protection Agency, Regulatory Impact Analysis for the Clean Power Plan Final Rule, Table 3-12, August 2015, http://www2.epa.gov/sites/production/files/2015-08/documents/cpp-final-rule-ria.pdf
[iii] International Energy Agency, Analysis of Globally Installed Coal-fired Power Plant Fleet, 2012, https://www.iea.org/publications/freepublications/publication/CCS_Retrofit.pdf
[iv] Environmental Protection Administration, Clean Power Plan Proposed Rule – Regulatory Impact Analysis, June 2, 2014, http://www2.epa.gov/sites/production/files/2014-06/documents/20140602ria-clean-power-plan.pdf
[v] Environmental Protection Agency, Regulatory Impact Analysis for the Clean Power Plan Final Rule, Table 3-21, August 2015, http://www2.epa.gov/sites/production/files/2015-08/documents/cpp-final-rule-ria.pdf
[vi] NERA Economic Consulting, Energy and Economic Impacts Of EPA’s Clean Power Plan, November 7, 2015, http://www.americaspower.org/wp-content/uploads/2015/11/NERA-CPP-Final-Nov-7.pdf
[vii] Energy Ventures Analysis, EPA’s Clean Power Plan An Economic Impact Analysis, November 2015, http://nma.org/attachments/article/2368/11.13.15%20NMA_EPAs%20Clean
%20Power%20Plan%20%20An%20Economic%20Impact%20Analysis.pdf
