
Coal-fired electricity generation is far cleaner today than ever before. The popular misconception that our air quality is getting worse is wrong, as shown by EPA’s air quality data. Modern coal plants, and those retrofitted with modern technologies to reduce pollution, are a success story and are currently providing 30 percent of our electricity. Undoubtedly, pollution emitted by coal-fired power plants will continue to decrease as technology improves.
Executive Summary
America’s improving air quality is an untold success story. Even before Congress passed the Clean Air Act Amendments of 1970, air quality had been improving for decades. And since 1970, the six so-called criteria pollutants have declined significantly, even though the generation of electricity from coal-fired plants has increased by over 75 percent.[i] (The “criteria pollutants” are carbon monoxide, lead, sulfur dioxide [SO2], nitrogen oxides [NOx], ground-level ozone and particulate matter [PM]. They are called “criteria” pollutants because the EPA sets the criteria for permissible levels.) Total SO2 emissions from coal-fired plants were reduced by 85 percent between 1990 and 2015, and NOx emissions were reduced by 84 percent between 1990 and 2015. [ii]
The figure below shows the increases in gross domestic product (by 253 percent), vehicle miles traveled (190 percent), energy consumption (44 percent) and population (58 percent) since 1970, and it compares them to the decline in the aggregate emissions of criteria pollutants of 73 percent.[iii] Today, we produce and consume more energy, drive further and live more comfortably than we did in the past, all the while enjoying a cleaner environment.
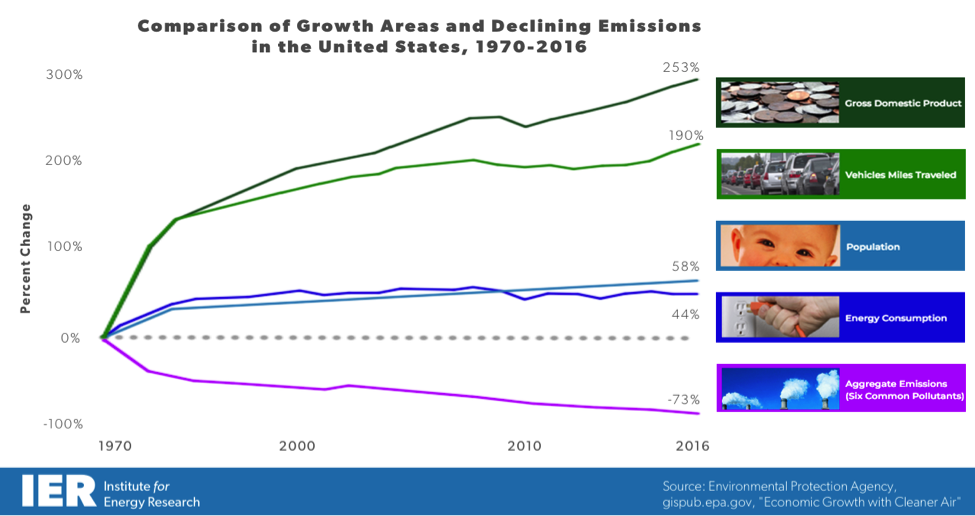
Source: EPA
One factor in improving air quality has been the pollution-control technologies used by coal-fired power plants. Today’s coal-fired electricity generating plants produce more power with less emissions of criteria pollutants than ever before. According to the National Energy Technology Laboratory (NETL), a new pulverized coal plant (operating at lower, “subcritical” temperatures and pressures) reduces the emission of NOx by 83 percent, SO2 by 98 percent and particulate matter (PM) by 99.8 percent, as compared with a similar plant having no pollution controls. Undoubtedly, air quality will continue to improve in the future because of improved technology.
Today, coal-fired electricity generation produces 30 percent of the electricity generated in America and provides many jobs. For example, Prairie State Energy Campus, a 1,600-megawatt supercritical coal plant in southern Illinois, generates clean electricity by using five technologies: nitrogen oxide controls, Selective Catalytic Reduction, dry electrostatic precipitators, sulfur dioxide scrubbers and wet electrostatic precipitators. Seven million tons of coal are mined a year at an adjacent coal mine to the power plant. Between its power plant, coal mine and other assets, the campus injects $785 million annually into the economy, employing over 600 workers. The plant operates at 98.5 percent availability while emitting 80 percent less in regulated pollutants than most existing power plants.[iv] The power plant delivers electricity to 2.5 million homes in eight states.[v] It can do this around the clock and is responsive to demand for power that consumers may have.
According to the BP Statistical Review of World Energy 2017, coal represented 16 percent of the total energy consumption in the United States and 28 percent of the world’s energy consumption in 2016. Globally, coal was second only to oil which had a 33 percent share.[vi] And according to the Energy Information Administration, almost 40 percent of the world’s electricity was generated from coal in 2016, greater than the 30 percent share in the United States.[vii]
Background
Even before Congress passed the Clean Air Act Amendments of 1970, creating the Environmental Protection Agency, air quality was improving. Prior to 1970, businesses saw certain types of pollution as waste, and worked to reduce them through technological improvements in order to increase efficiency. State and local policymakers worked to reduce pollution as well.
The Clean Air Act requires the Environmental Protection Agency (EPA) to set National Ambient Air Quality Standards to control pollutants considered harmful to public health or the environment: these are the so-called criteria pollutants.
Two of these pollutants, SO2 and NOx are the principal pollutants that cause acid precipitation (colloquially known as acid rain). SO2 and NOx emissions react with water vapor and other chemicals in the air to form acids that fall back to earth. Prior to controlling for these emissions, power plants produced most (about two-thirds) of the SO2 emissions in the United States. The majority (about 50 percent) of NOx emissions came from cars, buses, trucks and other forms of transportation, with power plants contributing about 25 percent. The remainder came from other sources, such as industrial and commercial boilers.
The Clean Air Act was modified in 1990 and introduced a cap on the total amount of SO2 emissions that may be emitted by electric power plants nationwide, thereby reducing the level of these emissions in the atmosphere. The approach used for compliance was a cap-and-trade program. In order to comply with the Clean Air Act Amendments of 1990, electric utilities could either switch to low sulfur coal, add equipment (e.g., scrubbers) to existing coal-fired power plants that removes SO2 emissions, purchase permits from other utilities that exceeded the reductions needed to comply with the cap or use other means of reducing emissions below the cap, such as operating high-sulfur units at a lower capacity utilization.
The Clean Air Interstate Rule in the Clean Air Act addresses interstate transport of air emissions from power plants. The Cross State Air Pollution Rule (CSAPR) replaces it and was upheld by the Supreme Court in October 2014. Phase 1 began in December 2014 and Phase II, with more stringent targets, took effect in January 2016. While CSAPR remains in place, the courts remanded CSAPR back to EPA in June 2015 for additional refinement affecting the Phase II implementation of NOx emission limits.[viii]
Under CSAPR, 27 states must restrict emissions of sulfur dioxide and/or nitrogen oxide, which are precursors to the formation of fine particulate matter (PM2.5) and ozone. CSAPR establishes four distinct allowance trading programs for SO2 and NOx composed of different member states based upon the contribution of each state to downwind non-attainment of National Ambient Air Quality Standards. CSAPR splits the allowance trading program into two regions for SO2, with trading permitted only between states within a group but not between groups.
In addition to interstate transport rule, the Clean Air Act Amendments of 1990 introduced the requirement for existing major stationary sources of NOx located in nonattainment areas to install and operate NOx controls which meet “Reasonably Available Control Technology” (RACT) standards. To implement this requirement, EPA developed a two-phase nitrogen oxide (NOx) program, with the first set of RACT standards for existing coal plants applied in 1996 while the second set was implemented in 2000. Dry bottom wall-fired and tangential-fired boilers, the most common boiler types, are referred to as Group 1 Boilers, and were required to make significant reductions beginning in 1996 and further reductions in 2000. Relative to their uncontrolled emission rates, which range roughly between 0.6 and 1.0 pounds per million Btu, they are required to make reductions between 25 percent and 50 percent to meet the Phase I limits and further reductions to meet the Phase II limits. All new fossil units are required to meet current standards. In pounds per million Btu, these limits are 0.11 for conventional coal, 0.02 for advanced coal, 0.02 for combined cycle and 0.08 for combustion turbines.
The Mercury and Air Toxics Standards rule (MATS) was finalized in December 2011 to fulfill EPA’s requirement to regulate mercury emissions from power plants. MATS also regulates other hazardous air pollutants (HAPS) such as hydrogen chloride (HCl) and fine particulate matter (PM2.5). MATS applies to coal and oil-fired power plants with a nameplate capacity greater than 25 megawatts. The standards were scheduled to take effect in 2015 but allow for a one-year waiver to comply. They also require all qualifying units to achieve the maximum achievable control technology (MACT) for each of the three covered pollutants. All power plants are required to reduce their mercury emissions to 90 percent below their uncontrolled emissions levels. When plants alter their configuration by adding equipment such as a Selective Catalytic Reduction to remove NOx or an SO2 scrubber, removal of mercury is often a resulting co-benefit. Plants can also add activated carbon injection systems specifically designed to remove mercury. Activated carbon can be injected in front of existing particulate control devices or a supplemental fabric filter can be added with activated carbon injection capability.
Coal Industry Emissions Reduction
Of the 266,620 megawatts of coal-fired capacity reporting their control technologies to the Energy Information Administration in 2016, 81 percent (215,438 megawatts) have flue gas desulfurization equipment (scrubbers), 82 percent (219,745 megawatts) have electrostatic precipitators, 36 percent (96,258) have fabric filters (baghouses), 68 percent (182,175 megawatts) have select catalytic reduction systems, 54 percent (145,050 megawatts) have advanced carbon injection systems and 9 percent (24,989 megawatts) have direct sorbent injection systems. [ix]
The following graph compares SO2 and NOx emissions from coal-fired power plants from 1990 to 2015. Between 1990 and 2015, SO2 emissions from coal-fired plants were reduced by 85 percent and NOx emissions were reduced by 84 percent.
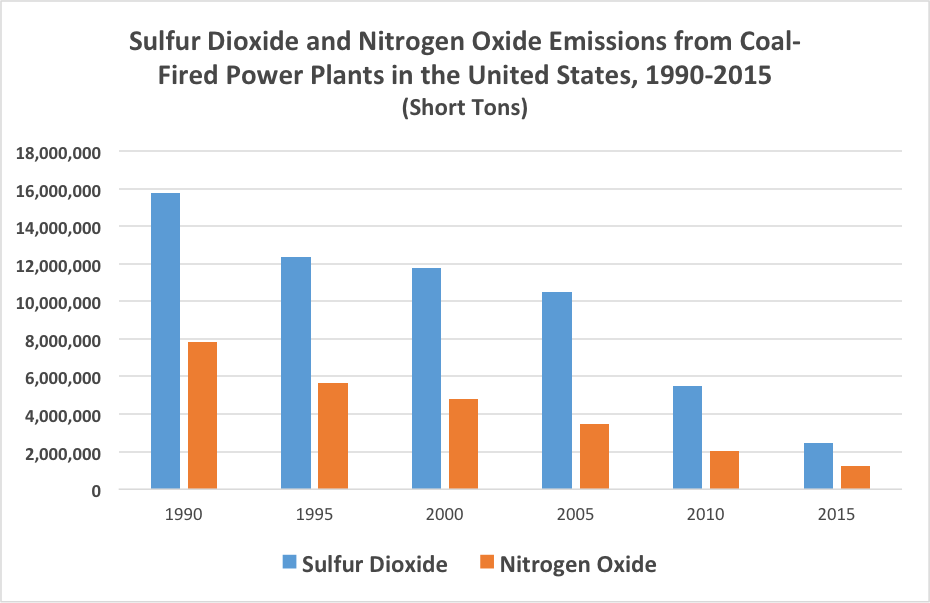
Source: Energy Information Administration
A study by the National Energy Technology Laboratory (NETL) compared the emission rates from pulverized coal plants and integrated gasification combined cycle plants based on environmental regulations to control sulfur dioxide (SO2), nitrogen oxide (NOx), mercury (Hg), particulate matter (PM) and carbon dioxide (CO2) at a greenfield site, assuming capacity factors of 85 percent, which would require the plants to be at the top of the dispatch order. Mercury, SO2, NOx and PM are controlled with dry sorbent injection (DSI) and activated carbon injection (ACI); wet flue gas desulfurization (FGD), low NOx burners (LNB) and Selective Catalytic Reduction (SCR) and a baghouse, respectively. All of the power plant configurations with carbon capture are designed to achieve 90 percent capture, resulting in atmospheric CO2 emissions far below the proposed EPA regulation. Integrated gasification units have lower levels of emissions than pulverized coal plants.
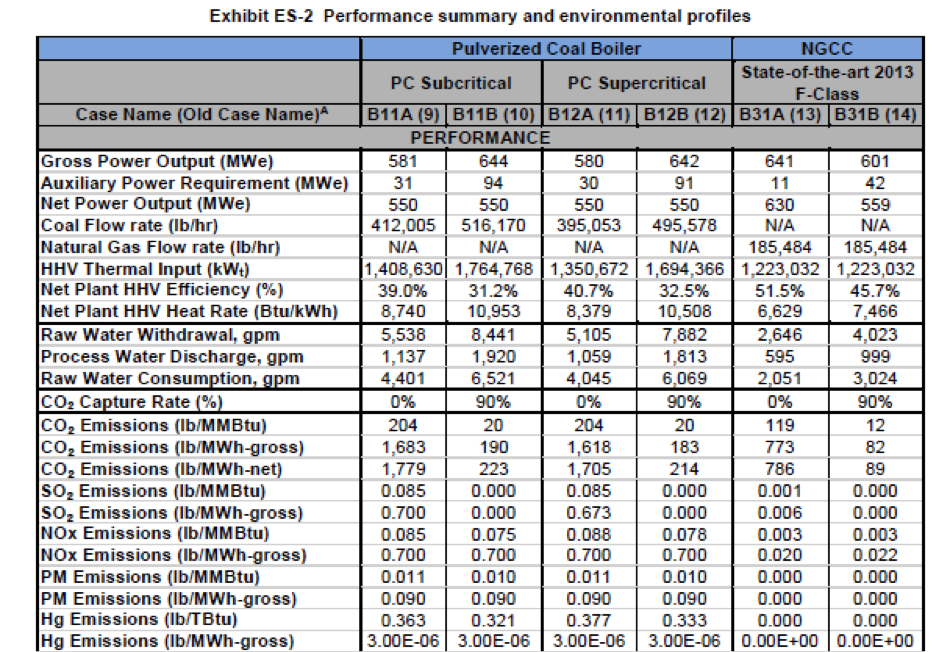
Source: NETL
According to NETL, for a new pulverized coal plant (subcritical), pollution controls reduce NOx emissions 83 percent, SO2 emissions by 98 percent and PM by 99.8 percent when compared with a similar plant with no pollution controls. The target emission level for NOx is 0.085 lb/MMBtu, for SO2 is 0.085 lb/MMBtu and for PM is 0.011 lb/MMBtu.[x] Without control technologies, a subcritical coal plant would emit 0.5 lb/MMBtu of NOx, 4.35 lb/MMBtu of SO2 and 6.5 lb/MMBtu of PM. The figure below graphically depicts the criteria pollutants from a new controlled plant vs. a new uncontrolled plant.
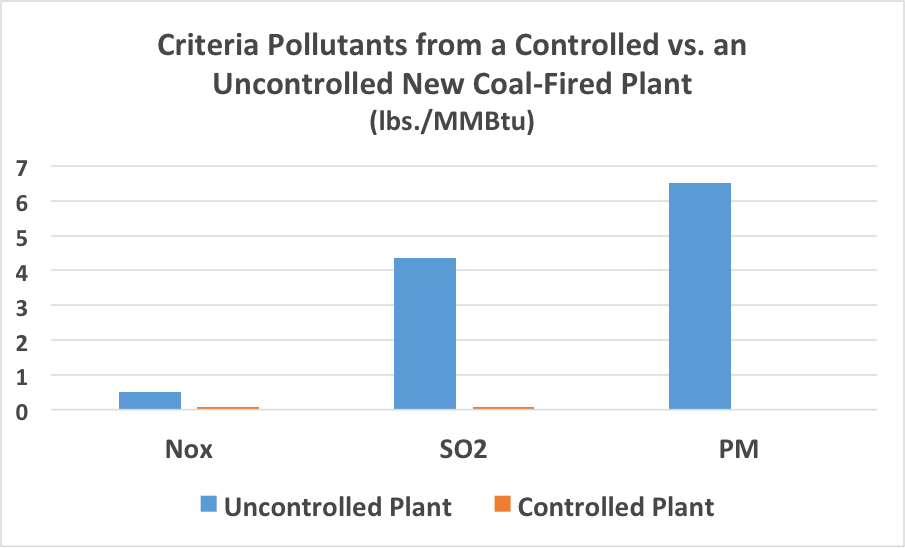
Source: NETL
Cost Factors in Emission Reductions
According to the EIA, the costs of adding flue gas desulfurization (FGD) equipment to remove sulfur dioxide, in 2015 dollars, range from $952 per kilowatt for a unit less than 100 megawatts to $417 a kilowatt for a unit 700 megawatts or larger. The costs for SCR equipment to remove nitrogen oxides range from $424 per kilowatt for a unit less than 100 megawatts to $193 per kilowatt for a unit that is 700 megawatts or larger. The costs for fabric filters (FF) range from $274 per kilowatt for a unit less than 100 megawatts to $141 per kilowatt for a unit that is 700 megawatts or larger. The costs for direct sorbent injection (DSI) range from $196 per kilowatt for a unit that is less than 100 megawatts to $30 per kilowatt for a unit that is 700 megawatts or larger. The costs per megawatt of capacity decline with plant size. FGD units are assumed to remove 95 percent of the SO2 and SCR units are assumed to remove 90 percent of the NOx. DSI units remove 70 percent of SO2, but DSI is available only under MATS as its primary function is to remove hydrogen chloride. [xi] (See table below.)
Coal Plant Retrofit Costs
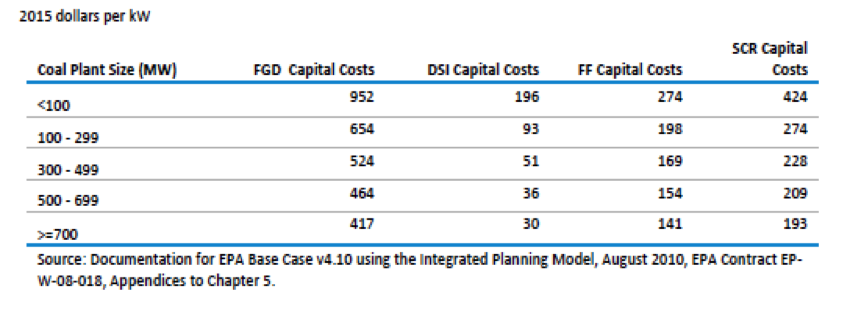
Source: EIA
The NETL study provides estimates of both the capital cost and the levelized cost of these technologies, which are given in the table below in 2011 dollars. The levelized cost is the present value of the total cost of building and operating the plant over its economic life, converted to equal annual payments. The plant costs range from $1,960 to $2,026 per kilowatt for a 550 megawatt coal plant and $685 per kilowatt for a 630 megawatt natural gas combined cycle plant. The levelized plant cost was computed using the following fuel prices: $2.94/MMBtu for coal and $6.13/MMBtu for natural gas. The levelized coal plant costs are about 8.2 cents per kWh and for natural gas combined cycle 5.76 cents per kWh.
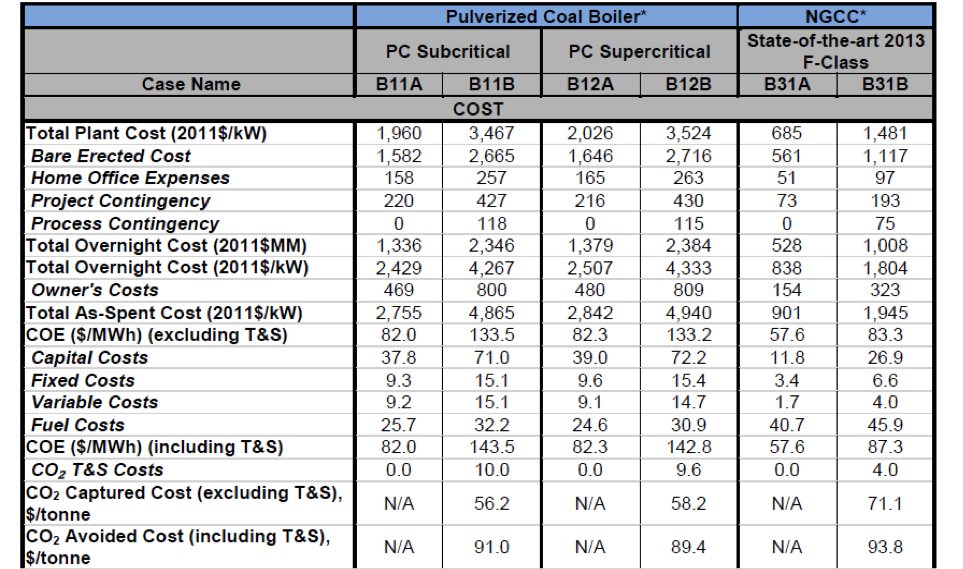
Source: NETL
Coal-fired electricity generation is far cleaner today than ever before. The popular misconception that our air quality is getting worse is wrong, as shown by EPA’s data.[xii] Modern coal plants, and those retrofitted with modern technologies to reduce pollution, are a success story and are currently providing about 30 percent of our electricity. Undoubtedly, pollution emissions from coal-fired power plants will continue to fall as technology improves.
Cap-and-Trade: “Acid Rain” versus Greenhouse Gases
The results of using a cap-and-trade system to fight “acid rain” have led some to argue that it is a model for efforts to reduce carbon dioxide emissions. But the analogy fails. Stark differences exist between the “acid rain” emission-reduction program and the challenge of reducing carbon dioxide, a natural byproduct of combustion, emitted by natural and man-made sources.
Carbon dioxide is emitted in the U.S. by hundreds of millions of sources, including every personal automobile, the appliances many of us use to cook our food and heat our homes and the businesses upon which we depend for our livelihoods, to name a few. The “acid rain” emission reduction program was initially limited to 110 site-specific utility plants, and then later expanded to 445 plants.[xiii] In addition, carbon dioxide is a world-wide byproduct of combustion, whereas all criteria pollutants are local or regional. In other words, what the United States did for SO2 and NOx directly affected air quality here, while national action to limit carbon dioxide emissions will have little bearing on aggregate global emissions.
Furthermore, at the time of the SO2 and NOx reduction program, alternative low sulfur coal sources existed and utilities had available affordable and proven technologies to utilities to reduce their emissions. When Congress passed the Clean Air Act Amendments of 1990, coal-fired utilities could responsibly reduce emissions from their plants using various options that limited cost impacts to the consumer.
In addition, attempts to extrapolate the “acid rain” success story to the challenge of reducing carbon dioxide emissions fail to recognize the history of similar programs in other parts of the world. For example, the “Emissions Trading Scheme” of the European Union has been ineffective at reducing carbon dioxide emissions at the same time it has increased prices and harmed businesses and consumers.[xiv] Further, the EU program has enriched some companies and industries at the expense of consumers.
A recent study by Laurie Williams and Allen Zabel, career employees of the Environmental Protection Agency, makes these points about what the authors call the “Acid Rain Myth.”[xv] As the authors explain, those who champion the use of cap-and-trade to address global warming ignore the crucial distinctions between the issues we faced in 1990 with acid rain and the issues we face today with global warming.
The following highlights Williams and Zabel’s study demonstrate that the experience of the acid rain program cannot and should not be compared to cap and trade for greenhouse gas emissions:
- “Most importantly, the success of the Acid Rain program did not depend on replacing the vast majority of our existing energy infrastructure with new infrastructure in a relatively short time. Nor did it depend on spurring major innovation. Rather, the Acid Rain program was successful as a mechanism to guide existing facilities to undertake a fuel switch to a readily available substitute, the low sulfur coal in Wyoming’s Powder River Basin.”
- “The goal of the Acid Rain program was to reduce sulfur dioxide emissions, while keeping the cost of energy from coal low. To be effective, climate change legislation must do the opposite; it must gradually increase the relative price of energy from coal and other fossil fuels to create the appropriate incentives for both conservation and the scale-up of clean energy.”
- “Further, the Acid Rain program did not allow any outside offsets and so provides no basis for the widespread assumption that an offset program will help with climate change. In addition, the success of the program was aided by the low, competitive price of low-sulfur coal.”
- “According to Professor Don Munton, author of ‘Dispelling the Myths of the Acid Rain Story’ the impact of the program has been overstated: The potential for a massive switch to low sulfur coal was no secret. Such coal was cheap and available, and it became cheaper and more available throughout the 1980s. Indeed, low-sulfur coal became very competitive with high-sulfur supplied well before the Clean Air Act became law.”
Conclusion
Coal remains an economically vital component of the U.S. and world energy market. Coal-fired electricity is now an environmental product, utilizing the latest technology to control each of its major criteria pollutants. The aspersion that coal is the “dirtiest fossil fuel” masks this reality.
In many parts of the world, the major environmental opportunity is to clean-up existing coal plants and build new plants using modern emission-control technology. The false choice is to close plants (or not build them) in favor of intermittent renewables.
The U.S. success story is a model for the developing world. The mechanisms available to reduce pollutants allow for more generation of energy with less pollution. But this success cannot be extrapolated to the regulation and reduction of carbon dioxide, a much more challenging undertaking. None of the conditions existing at the time of the apparent success of the SO2 and NOx reduction program apply to carbon dioxide. The challenges presented by the control and regulation of carbon dioxide have no parallels in the history of emission regulation.
[i] Energy Information Administration, Monthly Energy Review, https://www.eia.gov/totalenergy/data/monthly/pdf/sec7_5.pdf
[ii] Energy Information Administration, https://www.eia.gov/electricity/data.php#elecenv
[iii] Environmental Protection Agency, https://gispub.epa.gov/air/trendsreport/2017/#growth_w_cleaner_air
[iv] Wikipedia, Prairie State Energy Campus, https://en.wikipedia.org/wiki/Prairie_State_Energy_Campus
[v] Prairie State Energy Campus, http://www.prairiestateenergycampus.com/
[vi] BP Statistical Review of World Energy 2017, https://www.bp.com/en/global/corporate/energy-economics/statistical-review-of-world-energy/downloads.html
[vii] Energy Information Administration, International Energy Outlook 2017, Tables H12 and H15, https://www.eia.gov/outlooks/ieo/ieo_tables.php
[viii] Energy Information Administration, Electricity Market Module, https://www.eia.gov/outlooks/aeo/assumptions/pdf/electricity.pdf
[ix] Energy Information Administration, Electric Power Annual, Table 9.2, https://www.eia.gov/electricity/data.php#elecenv
[x] National Energy Technology Laboratory, Cost and Performance Baseline for Fossil Energy Plants, July 31, 2015, https://www.netl.doe.gov/energy-analyses/temp/CostandPerformanceBaselineforFEPlantsVol1bBitCoalIGCCtoElecRev2bYearDollarUpdate_073115.pdf
[xi] Energy Information Administration, Assumptions to the Electricity Market Module for Annual Energy Outlook 2017, https://www.eia.gov/outlooks/aeo/assumptions/pdf/electricity.pdf
[xii] Environmental Protection Agency, https://gispub.epa.gov/air/trendsreport/2017/#growth_w_cleaner_air
[xiii] Kenneth P. Green et. al, Climate Change: Caps vs. Taxes, American Enterprise Institute, (June 2007) http://www.aei.org/publication/climate-change-caps-vs-taxes/
[xiv] See European Union, Emissions trading: 2007 verified emissions from EU ETS businesses, May 23, 2008, http://europa.eu/rapid/pressReleasesAction.do?reference=IP/08/787&format=HTML&aged=0&language=EN&guiLanguage=en
[xv] Keeping Our Eyes on the Wrong Ball, 2/21/09, http://www.carbonfees.org/home/Cap-and-TradeVsCarbonFees.pdf
