
The Energy Information Administration released its Annual Energy Outlook 2013 reference case forecast this week, extending its forecast period to the year 2040.[i] The trends compared to last year’s forecast show greater oil and natural gas production, and slightly lower liquid fuels and coal consumption. Like today, fossil fuels dominate energy markets in 2040 but with a slightly lower share, a 78 percent share compared to 82 percent in 2011. Coal and petroleum lose share in 2040 compared to 2011, while natural gas and renewable energy gain share. (See chart below.)
Energy Consumption Fuel Shares, 2011 and 2040

Source: Energy Information Administration, Annual Energy Outlook 2013, http://www.eia.gov/forecasts/aeo/er/pdf/appa.pdf and http://www.eia.gov/forecasts/aeo/er/pdf/tbla17.pdf
Oil Production, Liquids Consumption and Net Imports
Due to hydraulic fracturing and horizontal drilling technology, oil production increases to 7.5 million barrels per day by 2019 from 5.6 million barrels per day in 2011. The increase is primarily from onshore production, mainly from shale oil and tight oil produced on private lands. In 2040, onshore tight oil production accounts for 51 percent of total lower 48 onshore oil production, compared to 33 percent in 2011. Oil production from onshore areas is more than twice that produced in offshore areas, which are predominantly in federally controlled waters. Offshore production fluctuates between 1.4 and 1.75 million barrels per day. After 2020, total oil production remains above 2011 levels but begins to lessen reaching 6.1 million barrels per day in 2040 as development moves to lower-productivity areas. (See chart below.) Alaskan oil production continues to decline at a rate of 1.1 percent per year as the federal government is not opening new Alaskan areas to exploration, putting the Trans-Alaska Pipeline System (TAPS) at operational risk since it was designed for oil volumes over 5 times what is being forecast.

Source: Energy Information Administration, Annual Energy Outlook 2013, http://www.eia.gov/forecasts/aeo/er/executive_summary.cfm
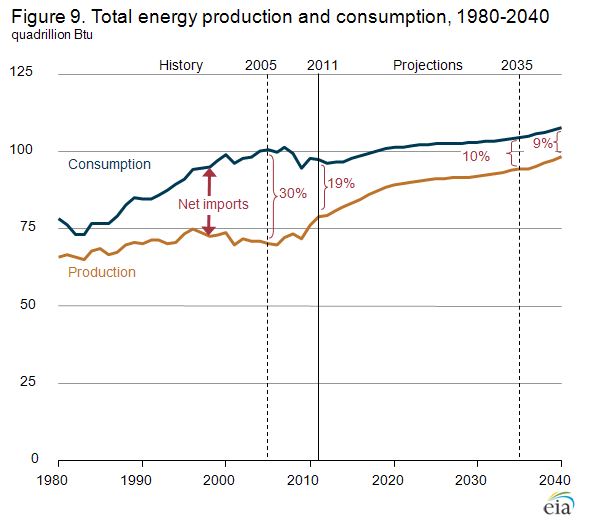
Primarily due to increased oil production, U.S. dependence on imported petroleum declines. U.S. net petroleum imports decline to 34 percent in 2019 from 45 percent in 2011. But, they increase to 37 percent by 2040 due to the lower domestic oil production after 2020. Helping the net petroleum import picture is lower demand as a result of Corporate Average Fuel Economy (CAFE) standards for new light duty vehicles which reach 47.3 miles per gallon by 2025. The new CAFE standards increase the cost of automobiles and result in millions of drivers not being able to purchase a new vehicle.
While total liquid fuels consumption falls, consumption of domestically produced biofuels increases from 1.3 quadrillion Btu in 2011 to 2.1 quadrillion Btu in 2040, and its share of the U.S. liquid fuels market increases from 3.5 percent in 2011 to 5.8 percent in 2040. Compared to last year’s forecast, however, biofuels are much lower due to less flex fuel vehicle demand, a smaller motor gasoline pool for blending ethanol, and lower production of cellulosic biofuels. Cellulosic biofuels are still not commercially available and cannot meet their targets set by the Energy Independence and Security Act of 2007; their production tax credit is scheduled to expire at the end of 2012 and is not incorporated in the forecast. Despite the CAFE mandate, future sales of battery-powered electric vehicles are 65 percent lower than last year’s projections due to their low sales volume, high costs, and continued problems, particularly with batteries.

Source: Energy Information Administration, Annual Energy Outlook 2013, http://www.eia.gov/forecasts/aeo/er/early_production.cfm
Natural Gas Production, Consumption and Exports
Natural gas production increases throughout the projection period, outpacing domestic consumption by 2020 and spurring net exports of natural gas. Natural gas production increases to 33 trillion cubic feet in 2040 from 23 trillion cubic feet in 2011. The majority of the increase is from onshore production, which increases from 20.5 trillion cubic feet in 2011 to 29.1 trillion cubic feet in 2040 with the largest increase from shale gas production, which increases from 7.85 trillion cubic feet in 2011 to 16. 7 trillion cubic feet in 2040 due to continued use of hydraulic fracturing and horizontal drilling, primarily on private lands. Offshore natural gas production fluctuates between 1.8 and 2.8 trillion cubic feet per year. Alaskan natural gas production increases from 0.35 trillion cubic feet to 1.18 trillion cubic feet as Alaska becomes an exporter of liquefied natural gas (LNG).
Domestic natural gas use is projected to increase by over 5 trillion cubic feet between 2011 and 2040, primarily in the electric generation and industrial sectors. The strong growth in shale gas production spurs industrial production growth due to relatively low natural gas prices, which lower the costs of both raw materials and energy, particularly through 2025. Industrial natural gas demand increases to 8.45 quadrillion Btu in 2040, from 6.9 quadrillion Btu in 2011. Most of the increase in industrial energy demand is the result of higher output in the manufacturing sector. The advent of shale gas and low natural gas prices increase natural gas’ share of electricity generation from 25 percent in 2011 to 30 percent in 2040.
 Source: Energy Information Administration, Annual Energy Outlook 2013, http://www.eia.gov/forecasts/aeo/er/executive_summary.cfm
The United States becomes a net exporter of LNG beginning in 2016, and an overall net exporter of natural gas in 2020. Exports of LNG from new liquefaction capacity in the Gulf Coast and Alaska begin in 2016 at a level of 0.6 billion cubic feet per day and increase to 4.5 billion cubic feet per day in 2027 due to increased use of LNG in markets outside North America, strong domestic production, and low U.S. natural gas prices relative to other global markets.
Coal Production, Consumption and Exports
While coal remains the leading fuel for U.S. electricity generation, its share of total generation falls from 42 percent in 2011 to 35 percent in 2040. Coal’s outlook is dampened by concerns about greenhouse gas emissions, low projected fuel prices for new natural gas-fired plants, slow growth in electricity demand, programs encouraging and mandating renewable fuel use, and the implementation of new environmental regulations from the Environmental Protection Agency (e.g. Mercury and Air Toxics Standards and others). Primarily as a result of the later, coal-fired capacity is projected to fall from 318 gigawatts in 2011 to 278 gigawatts in 2040.
 Source: Energy Information Administration, Annual Energy Outlook 2013, http://www.eia.gov/forecasts/aeo/er/early_elecgen.cfm
While there is overall growth in coal production over the projection period from 1,096 million short tons in 2011 to 1,167 million short tons in 2040, there is a substantial decline between 2001 and 2016 due to low natural gas prices and the retirement of a sizable amount of coal-fired generating capacity due to EPA regulations. After 2016, increases in coal use for electricity generation and exports lead to a gradual recovery in U.S. coal production with coal production growing at an average rate of 0.6 percent per year. U.S. coal exports are expected to increase from 107 million short tons in 2011 to 159 million short tons in 2040. Coal producers in both the Interior and Western regions are projected to see their shares of total U.S. coal production increase over the projection period, while Appalachia’s share declines from 38 percent in 2011 to 32 percent in 2030.
Renewable Energy
The share of U.S. electricity generation from renewable fuels (including conventional hydropower) increases from 13 percent in 2011 to 16 percent in 2040 due to federal tax credits, state-level policies, and federal requirements to use more biomass-based transportation fuels, some of which can produce electricity as a byproduct of their production process. Annual Energy Outlook 2013 updated the capital costs for new generating technologies and resulted in significant initial cost reductions for wind (13 percent) and solar photovoltaic (22 percent) compared to last year’s capital costs. As a result, solar’s capacity increases by 45 gigawatts between 2011 and 2040 with it being fairly equally distributed between central station utilities and the building and industrial sectors, and wind’s capacity on shore increases by 42 gigawatts. There is no wind offshore being built in the forecast.
[i] Energy Information Administration, Annual Energy Outlook 2013, Early Release, December 5, 2012, http://www.eia.gov/forecasts/aeo/er/
